Join us at FabCon Vienna from September 15-18, 2025
The ultimate Fabric, Power BI, SQL, and AI community-led learning event. Save €200 with code FABCOMM.
Get registered- Power BI forums
- Get Help with Power BI
- Desktop
- Service
- Report Server
- Power Query
- Mobile Apps
- Developer
- DAX Commands and Tips
- Custom Visuals Development Discussion
- Health and Life Sciences
- Power BI Spanish forums
- Translated Spanish Desktop
- Training and Consulting
- Instructor Led Training
- Dashboard in a Day for Women, by Women
- Galleries
- Data Stories Gallery
- Themes Gallery
- Contests Gallery
- Quick Measures Gallery
- Notebook Gallery
- Translytical Task Flow Gallery
- TMDL Gallery
- R Script Showcase
- Webinars and Video Gallery
- Ideas
- Custom Visuals Ideas (read-only)
- Issues
- Issues
- Events
- Upcoming Events
Compete to become Power BI Data Viz World Champion! First round ends August 18th. Get started.
- Power BI forums
- Forums
- Get Help with Power BI
- Desktop
- how to get total distinct count in Power BI
- Subscribe to RSS Feed
- Mark Topic as New
- Mark Topic as Read
- Float this Topic for Current User
- Bookmark
- Subscribe
- Printer Friendly Page
- Mark as New
- Bookmark
- Subscribe
- Mute
- Subscribe to RSS Feed
- Permalink
- Report Inappropriate Content
how to get total distinct count in Power BI
I have 2 tables.
Sector and ID columns are coming from 10-CSV file. Reason and Included columns are coming from 07-CSV file.
Filter with Included column as "Included". I do this filter by applying the filter to the table with the filters tab, not with the DAX.
Here is what I did so far:
Measure =

var reason_all = CALCULATE(DISTINCTCOUNT('10-CSV'[ID]))
var reason_blank = CALCULATE(DISTINCTCOUNT('10-CSV'[ID]),'07-CSV'[Reason] = BLANK())

var reason_A = CALCULATE(DISTINCTCOUNT('10-CSV'[ID]), '07-CSV'[Reason] = "A")

var reason_B = CALCULATE(DISTINCTCOUNT('10-CSV'[ID]), '07-CSV'[Reason] = "B")

var reason_C = CALCULATE(DISTINCTCOUNT('10-CSV'[ID]), '07-CSV'[Reason] = "C")

RETURN

VALUE(
IF(
    ISFILTERED('07-CSV'[Reason]),

        IF(
            VALUES(
            '07-CSV'[Reason]) = BLANK(),
            reason_blank/reason_all ,
            IF(
                VALUES(
                    '07-CSV'[Reason]) = "A",
                    reason_A/reason_all,
                IF(
                    VALUES(
                        '07-CSV'[Reason]) = "B",
                        reason_B/reason_all,
                        IF(
                            VALUES(
                                '07-CSV'[Reason]) = "C",
                                reason_C/reason_all
            ))))))
With this, I am always getting is 1. The problem is reason_all is not getting out correctly. It comes same as the other reasons. I think when I breakdown the table with the Reason column, it breakdown also.
But it should be like this in order to get the total distinct count of a sector:
With this, every reason will have its percentage of distribution in the same sector. For example, A reason in Retail should show the 8/412 = 0,019. Blank reason in Retail should show the 396/412 = 0,96.
ID column is in text type including values like "100021", "100023".
Solved! Go to Solution.
- Mark as New
- Bookmark
- Subscribe
- Mute
- Subscribe to RSS Feed
- Permalink
- Report Inappropriate Content
Hi @frknklcsln ,
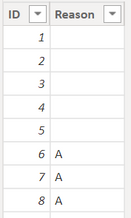
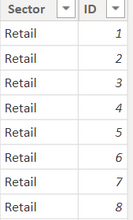
I created some data:
07-CSV file:
10-CSV file:
Here are the steps you can follow:
1. Create calculated table.
Table1 =
var _table1=
SUMMARIZE('10-CSV file',
'10-CSV file'[ID],
'10-CSV file'[Sector],"Reason",
CALCULATE(MAX('07-CSV file'[Reason]),FILTER(ALL('07-CSV file'),
'07-CSV file'[ID]='10-CSV file'[ID])))
var _table2=
ADDCOLUMNS(_table1,
"Count",
COUNTX(
    FILTER(_table1,
    [Sector]=EARLIER('10-CSV file'[Sector])&&[Reason]=EARLIER([Reason])),[ID]))
var _table3=
SUMMARIZE(
    _table2,
    [Sector],[Reason],[Count])
return
ADDCOLUMNS(
    _table3,
    "Sum",
    SumX(
    FILTER(_table3,
    [Sector]=EARLIER('10-CSV file'[Sector])),[Count]))
2. Create measure.
COUNTid =
CALCULATE(
    MAX('Table1'[Count]),
    FILTER(ALL('Table1'),
    'Table1'[Sector]=MAX('10-CSV file'[Sector])&&'Table1'[Reason]=MAX('07-CSV file'[Reason])))
SUMid =
CALCULATE(
SUM('Table1'[Sum]),
FILTER(ALL('Table1'),
'Table1'[Sector]=MAX('10-CSV file'[Sector])&&'Table1'[Reason]=MAX('07-CSV file'[Reason])))Desired Output =
DIVIDE(
[COUNTid],
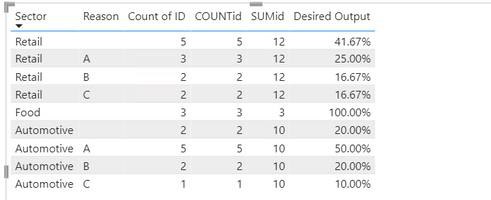
[SUMid])3. Result:
If you need pbix, please click here.
Best Regards,
Liu Yang
If this post helps, then please consider Accept it as the solution to help the other members find it more quickly
- Mark as New
- Bookmark
- Subscribe
- Mute
- Subscribe to RSS Feed
- Permalink
- Report Inappropriate Content
hi @Anonymous again, I want to add a new filter to the table1. How can I apply this?
There is a transport mode column in the 07-csv file. And there is another column called Region in the 04-csv file. So the filter is going to be like this:
If the '07-CSV'[transport mode] = "Air",
Then '04-CSV'[Region] <> "Middle East" & '04-CSV'[Region] <> "Europe"
I tried to add this to the Table1 table that you created but I couldnt.
07-csv file has the ID column which I use as the primary key for lookup. 10-CSV has ID and Sec_ID column. Same ID number may contain different Sec_ID numbers. You can think about invoices. Same invoice number may contain different delivery numbers etc.
04-csv has the Sec_ID column. So, I cant create a relationship directly between the 04-csv file and the 07-csv file.
Thank you very much again.
- Mark as New
- Bookmark
- Subscribe
- Mute
- Subscribe to RSS Feed
- Permalink
- Report Inappropriate Content
Hi @Anonymous , you are an angel. It worked, thank you.
- Mark as New
- Bookmark
- Subscribe
- Mute
- Subscribe to RSS Feed
- Permalink
- Report Inappropriate Content
@frknklcsln , try a measure like
Divide(
CALCULATE(DISTINCTCOUNT('10-CSV'[ID]), filter(Allselected('07-CSV') , '07-CSV'[Reason] = max('07-CSV'[Reason]))
, Filter(allselected('10-CSV') , [ID] = max('10-CSV'[ID]) ))
, CALCULATE(DISTINCTCOUNT('10-CSV'[ID])
, Filter(allselected('10-CSV') , [ID] = max('10-CSV'[ID]) ))
)
Seem like there are two tables
- Mark as New
- Bookmark
- Subscribe
- Mute
- Subscribe to RSS Feed
- Permalink
- Report Inappropriate Content
Thank you for your time and effort.
Unfortunately, it still shows as 1. The numerator part of the divide function returns blank and the denominator part of the function returns as like mine(2. pic). It gave me an idea tho. Thank you again.


