FabCon is coming to Atlanta
Join us at FabCon Atlanta from March 16 - 20, 2026, for the ultimate Fabric, Power BI, AI and SQL community-led event. Save $200 with code FABCOMM.
Register now!- Power BI forums
- Get Help with Power BI
- Desktop
- Service
- Report Server
- Power Query
- Mobile Apps
- Developer
- DAX Commands and Tips
- Custom Visuals Development Discussion
- Health and Life Sciences
- Power BI Spanish forums
- Translated Spanish Desktop
- Training and Consulting
- Instructor Led Training
- Dashboard in a Day for Women, by Women
- Galleries
- Data Stories Gallery
- Themes Gallery
- Contests Gallery
- Quick Measures Gallery
- Notebook Gallery
- Translytical Task Flow Gallery
- TMDL Gallery
- R Script Showcase
- Webinars and Video Gallery
- Ideas
- Custom Visuals Ideas (read-only)
- Issues
- Issues
- Events
- Upcoming Events
Calling all Data Engineers! Fabric Data Engineer (Exam DP-700) live sessions are back! Starting October 16th. Sign up.
- Power BI forums
- Forums
- Get Help with Power BI
- Desktop
- Re: get previous values per group
- Subscribe to RSS Feed
- Mark Topic as New
- Mark Topic as Read
- Float this Topic for Current User
- Bookmark
- Subscribe
- Printer Friendly Page
- Mark as New
- Bookmark
- Subscribe
- Mute
- Subscribe to RSS Feed
- Permalink
- Report Inappropriate Content
get previous values per group
Hello everybody,
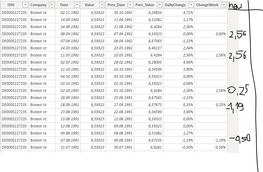
I would like to have the previous values (see screenshot) displayed for the "ChangeWeek" column. So there should be a new column (see screenshot "new"), where the previous value per group (ISIN) is always displayed. It is important that it is a column, not a measure. I already got a solution in another post (https://community.powerbi.com/t5/Desktop/Get-weekly-values-and-previous-values/m-p/927847/highlight/...), but it's a measure there and not a column. Does anyone have a solution?
PBI File: https://we.tl/t-wYhdl5R56e
Best regards, hwoehler
Solved! Go to Solution.
- Mark as New
- Bookmark
- Subscribe
- Mute
- Subscribe to RSS Feed
- Permalink
- Report Inappropriate Content
Try , as new columns
Column = maxx(filter('Table','Table'[ISIN]=EARLIER('Table'[ISIN]) && not(ISBLANK('Table'[ChangeWeek])) && 'Table'[Date]<EARLIER('Table'[Date])),'Table'[Date])

Column 2 = if(ISBLANK('Table'[ChangeWeek]),BLANK(),maxx(FILTER('Table','Table'[ISIN]=EARLIER('Table'[ISIN]) && ('Table'[Date])=EARLIER('Table'[Column])),('Table'[ChangeWeek])))
https://www.dropbox.com/s/kexca62xapy8j41/Filter2.pbix?dl=0
- Mark as New
- Bookmark
- Subscribe
- Mute
- Subscribe to RSS Feed
- Permalink
- Report Inappropriate Content
- Mark as New
- Bookmark
- Subscribe
- Mute
- Subscribe to RSS Feed
- Permalink
- Report Inappropriate Content
Hi @amitchandak ,
you're right. The screenshot is misleading. This screenshot should be better:
Best regards, hwoehler
- Mark as New
- Bookmark
- Subscribe
- Mute
- Subscribe to RSS Feed
- Permalink
- Report Inappropriate Content
Try , as new columns
Column = maxx(filter('Table','Table'[ISIN]=EARLIER('Table'[ISIN]) && not(ISBLANK('Table'[ChangeWeek])) && 'Table'[Date]<EARLIER('Table'[Date])),'Table'[Date])

Column 2 = if(ISBLANK('Table'[ChangeWeek]),BLANK(),maxx(FILTER('Table','Table'[ISIN]=EARLIER('Table'[ISIN]) && ('Table'[Date])=EARLIER('Table'[Column])),('Table'[ChangeWeek])))- Mark as New
- Bookmark
- Subscribe
- Mute
- Subscribe to RSS Feed
- Permalink
- Report Inappropriate Content
Yep, EARLIER.
Follow on LinkedIn
@ me in replies or I'll lose your thread!!!
Instead of a Kudo, please vote for this idea
Become an expert!: Enterprise DNA
External Tools: MSHGQM
YouTube Channel!: Microsoft Hates Greg
Latest book!: DAX For Humans
DAX is easy, CALCULATE makes DAX hard...
- Mark as New
- Bookmark
- Subscribe
- Mute
- Subscribe to RSS Feed
- Permalink
- Report Inappropriate Content
So generally you are going to do this with something like EARLIER - See my article on Mean Time Between Failure (MTBF) which uses EARLIER: http://community.powerbi.com/t5/Community-Blog/Mean-Time-Between-Failure-MTBF-and-Power-BI/ba-p/3395.... What is the measure calculation that fixed it? Should be very translatable to a column.
Follow on LinkedIn
@ me in replies or I'll lose your thread!!!
Instead of a Kudo, please vote for this idea
Become an expert!: Enterprise DNA
External Tools: MSHGQM
YouTube Channel!: Microsoft Hates Greg
Latest book!: DAX For Humans
DAX is easy, CALCULATE makes DAX hard...
Helpful resources

FabCon Global Hackathon
Join the Fabric FabCon Global Hackathon—running virtually through Nov 3. Open to all skill levels. $10,000 in prizes!

Power BI Monthly Update - September 2025
Check out the September 2025 Power BI update to learn about new features.

