Join us at FabCon Vienna from September 15-18, 2025
The ultimate Fabric, Power BI, SQL, and AI community-led learning event. Save €200 with code FABCOMM.
Get registered- Power BI forums
- Get Help with Power BI
- Desktop
- Service
- Report Server
- Power Query
- Mobile Apps
- Developer
- DAX Commands and Tips
- Custom Visuals Development Discussion
- Health and Life Sciences
- Power BI Spanish forums
- Translated Spanish Desktop
- Training and Consulting
- Instructor Led Training
- Dashboard in a Day for Women, by Women
- Galleries
- Data Stories Gallery
- Themes Gallery
- Contests Gallery
- Quick Measures Gallery
- Notebook Gallery
- Translytical Task Flow Gallery
- TMDL Gallery
- R Script Showcase
- Webinars and Video Gallery
- Ideas
- Custom Visuals Ideas (read-only)
- Issues
- Issues
- Events
- Upcoming Events
Enhance your career with this limited time 50% discount on Fabric and Power BI exams. Ends August 31st. Request your voucher.
- Power BI forums
- Forums
- Get Help with Power BI
- Desktop
- formula dax porcentaje crecimiento
- Subscribe to RSS Feed
- Mark Topic as New
- Mark Topic as Read
- Float this Topic for Current User
- Bookmark
- Subscribe
- Printer Friendly Page
- Mark as New
- Bookmark
- Subscribe
- Mute
- Subscribe to RSS Feed
- Permalink
- Report Inappropriate Content
formula dax porcentaje crecimiento
Estimados,
tengo una columnas de año 2017,meses de enero a diciembre, otra columna de ventas, quiero una columna adicional de crecimiento en porcentaje que compare las ventas de febrero con enero, marzo con febrero, abril con marzo asi...hasta diciembre con noviembre.
muchas gracias
Ricardo
Solved! Go to Solution.
- Mark as New
- Bookmark
- Subscribe
- Mute
- Subscribe to RSS Feed
- Permalink
- Report Inappropriate Content
Hi @Ricardo1,
I have columns for the year 2017, months for January to December, another column for sales, I want an additional column of growth in percentage that compares the sales from February to January, March to February, April to March as well ... to December to November .
Firstly add an index column in Query Editor mode.
In Data view mode, add a calculated column with below formula.
percentage =
VAR previousmonthsales =
    CALCULATE (
        SUM ( 'Monthly Sales'[Sales] ),
        FILTER (
            ALLEXCEPT ( 'Monthly Sales', 'Monthly Sales'[Year] ),
            'Monthly Sales'[Index]
                = EARLIER ( 'Monthly Sales'[Index] ) - 1
        )
    )
RETURN
    ( 'Monthly Sales'[Sales] - previousmonthsales )
        / previousmonthsales
Best regards,
Yuliana Gu
If this post helps, then please consider Accept it as the solution to help the other members find it more quickly.
- Mark as New
- Bookmark
- Subscribe
- Mute
- Subscribe to RSS Feed
- Permalink
- Report Inappropriate Content
Sres,
tengo una tabla columna meses( de enero a diciembre), columna ventas con importes en dolares.
necesito una columna calculando la tasa de crecimiento en porcentaje calculando de esta manera.
febrero con enero, marzo con febrero, abril con marzo, mayo con abril,...hasta diciembre con noviembre.
espero puedan ayudarme para hacer grafico en power bi.
Gracias
| Meses | ventas | Tasa de crecimiento |
| enero | $ 3.9M | |
| febrero | $ 3.8M | -4.1% |
| marzo | $ 4.4M | 17.5% |
| abril | $ 5.1M | 14.2% |
| mayo | $ 5.0M | -1.9% |
| junio | $ 4.4M | -10.9% |
| julio | $ 4.9M | 9.7% |
| agosto | $ 4.8M | -1.3% |
| septiembre | $ 4.4M | -8.4% |
| octubre | $ 5.2M | 17.7% |
| noviembre | $ 6.0M | 15.0% |
| diciembre | $ 4.6M | -22.3% |
- Mark as New
- Bookmark
- Subscribe
- Mute
- Subscribe to RSS Feed
- Permalink
- Report Inappropriate Content
Hi @Ricardo1,
I have columns for the year 2017, months for January to December, another column for sales, I want an additional column of growth in percentage that compares the sales from February to January, March to February, April to March as well ... to December to November .
Firstly add an index column in Query Editor mode.
In Data view mode, add a calculated column with below formula.
percentage =
VAR previousmonthsales =
    CALCULATE (
        SUM ( 'Monthly Sales'[Sales] ),
        FILTER (
            ALLEXCEPT ( 'Monthly Sales', 'Monthly Sales'[Year] ),
            'Monthly Sales'[Index]
                = EARLIER ( 'Monthly Sales'[Index] ) - 1
        )
    )
RETURN
    ( 'Monthly Sales'[Sales] - previousmonthsales )
        / previousmonthsales
Best regards,
Yuliana Gu
If this post helps, then please consider Accept it as the solution to help the other members find it more quickly.
- Mark as New
- Bookmark
- Subscribe
- Mute
- Subscribe to RSS Feed
- Permalink
- Report Inappropriate Content
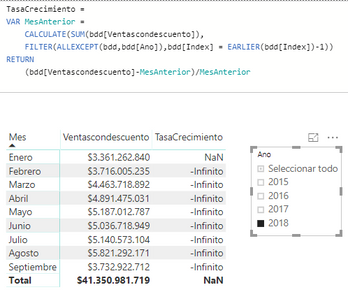
Good day Yuliana. I need exactly the same, try to Do and show me a message (Inifinito) and not the percentage. Could you help me ?. Thank you

- Mark as New
- Bookmark
- Subscribe
- Mute
- Subscribe to RSS Feed
- Permalink
- Report Inappropriate Content
Good day, I have the same problem. We appreciate help
Helpful resources
| User | Count |
|---|---|
| 78 | |
| 77 | |
| 37 | |
| 32 | |
| 30 |
| User | Count |
|---|---|
| 91 | |
| 79 | |
| 57 | |
| 48 | |
| 48 |


