Party with Power BI’s own Guy in a Cube
Power BI is turning 10! Tune in for a special live episode on July 24 with behind-the-scenes stories, product evolution highlights, and a sneak peek at what’s in store for the future.
Save the date- Power BI forums
- Get Help with Power BI
- Desktop
- Service
- Report Server
- Power Query
- Mobile Apps
- Developer
- DAX Commands and Tips
- Custom Visuals Development Discussion
- Health and Life Sciences
- Power BI Spanish forums
- Translated Spanish Desktop
- Training and Consulting
- Instructor Led Training
- Dashboard in a Day for Women, by Women
- Galleries
- Data Stories Gallery
- Themes Gallery
- Contests Gallery
- Quick Measures Gallery
- Notebook Gallery
- Translytical Task Flow Gallery
- TMDL Gallery
- R Script Showcase
- Webinars and Video Gallery
- Ideas
- Custom Visuals Ideas (read-only)
- Issues
- Issues
- Events
- Upcoming Events
Enhance your career with this limited time 50% discount on Fabric and Power BI exams. Ends August 31st. Request your voucher.
- Power BI forums
- Forums
- Get Help with Power BI
- Desktop
- filter to control/interact with only part of the c...
- Subscribe to RSS Feed
- Mark Topic as New
- Mark Topic as Read
- Float this Topic for Current User
- Bookmark
- Subscribe
- Printer Friendly Page
- Mark as New
- Bookmark
- Subscribe
- Mute
- Subscribe to RSS Feed
- Permalink
- Report Inappropriate Content
filter to control/interact with only part of the chart
Hello everyone, I am a new user of PBI and this is my first time posting a question in the forum. I wonder if it is possible for a visual level filter to interact with only part of a chart?
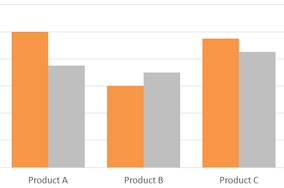
I have 2 column charts: 1 for global categories and 1 for each indivudual country. The first one is static which has the total count percentage for each category at a global level; The second one has the count percentage for each category filtered by a slicer of country list (200ish countries in total). The idea is to use just ONE clustered column to include both the percentage at the global level and at each indivisual country level. Something similar to the chart below:
So the orange columns are for global % which should remain static, while the grey columns are for each individual country controlled by a filter. The point behind this is to use the global % for each product as a benchmark for each country. Hope it makes sense and please let me know if it is possible or it is just too silly 🙂
Thanks!
- Mark as New
- Bookmark
- Subscribe
- Mute
- Subscribe to RSS Feed
- Permalink
- Report Inappropriate Content
Hi @Janet_PHQ,
According to your description above, you should be able to use ALL, or ALLEXPECT function which can ignores filters that might have been applied to create a measure to calculate the global % in your scenario. Then the global % won't be affected by the slicer of country list. ![]()
Regards
- Mark as New
- Bookmark
- Subscribe
- Mute
- Subscribe to RSS Feed
- Permalink
- Report Inappropriate Content
Hi @Janet_PHQ
@v-ljerr-msft is right. I've made an example of how to write this with DAX in a different post.
Link to post: http://community.powerbi.com/t5/Desktop/Calculate-of-a-total/m-p/213290#M94264
Hope it makes sense. If you want me to elaborate, I'll gladly do so.
Best,
Martin
- Mark as New
- Bookmark
- Subscribe
- Mute
- Subscribe to RSS Feed
- Permalink
- Report Inappropriate Content
Hi @Anonymous,
Thank you very much for the reply! It looks helpful but very hard to implement in my case. I will do more research later.
Thanks again![]()
- Mark as New
- Bookmark
- Subscribe
- Mute
- Subscribe to RSS Feed
- Permalink
- Report Inappropriate Content
Hi @Janet_PHQ,
If you have any issue with the formulas later, you can just post your table structures with some sample data here. Then we will try to further assist on it. ![]()
Regards
Helpful resources
| User | Count |
|---|---|
| 77 | |
| 74 | |
| 42 | |
| 32 | |
| 28 |
| User | Count |
|---|---|
| 99 | |
| 92 | |
| 50 | |
| 47 | |
| 46 |


