FabCon is coming to Atlanta
Join us at FabCon Atlanta from March 16 - 20, 2026, for the ultimate Fabric, Power BI, AI and SQL community-led event. Save $200 with code FABCOMM.
Register now!- Power BI forums
- Get Help with Power BI
- Desktop
- Service
- Report Server
- Power Query
- Mobile Apps
- Developer
- DAX Commands and Tips
- Custom Visuals Development Discussion
- Health and Life Sciences
- Power BI Spanish forums
- Translated Spanish Desktop
- Training and Consulting
- Instructor Led Training
- Dashboard in a Day for Women, by Women
- Galleries
- Data Stories Gallery
- Themes Gallery
- Contests Gallery
- QuickViz Gallery
- Quick Measures Gallery
- Visual Calculations Gallery
- Notebook Gallery
- Translytical Task Flow Gallery
- TMDL Gallery
- R Script Showcase
- Webinars and Video Gallery
- Ideas
- Custom Visuals Ideas (read-only)
- Issues
- Issues
- Events
- Upcoming Events
View all the Fabric Data Days sessions on demand. View schedule
- Power BI forums
- Forums
- Get Help with Power BI
- Desktop
- converting rows into column in powerquery
- Subscribe to RSS Feed
- Mark Topic as New
- Mark Topic as Read
- Float this Topic for Current User
- Bookmark
- Subscribe
- Printer Friendly Page
- Mark as New
- Bookmark
- Subscribe
- Mute
- Subscribe to RSS Feed
- Permalink
- Report Inappropriate Content
converting rows into column in powerquery
Hi All,
I have source data which is contain row level process step and i need to split into column level data in edit query transformation level.
ex: source file
Expected result using edit query: (Process row steps (input,reject,input2,review,review2,print) need to convert into column level with IN and OUT time)
result:
thanks,
Solved! Go to Solution.
- Mark as New
- Bookmark
- Subscribe
- Mute
- Subscribe to RSS Feed
- Permalink
- Report Inappropriate Content
Hi @MSuser5 ,
Here are the steps you can follow:
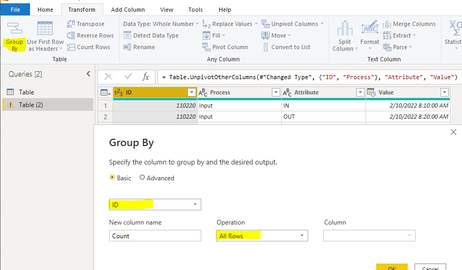
1. Go to Power Query – check [IN], [Out] – Unpivot Columns.
Result:
2. Transform – Group -- [ID] – Operation:All Rows.
3. Add Column – Custom Column – Enter the following code.
Table.AddIndexColumn([Count],"Rank",1,1)4. Selected [Count] – Remove.
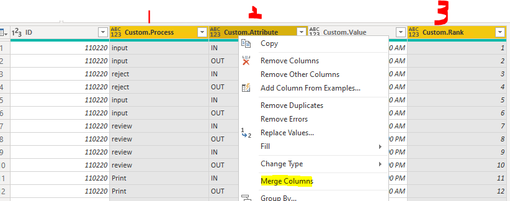
5. Expand [Custom] - Do not select column [ID] - OK.
6. Select the three columns [Custom.Process], [Custom.Attribute], [Custom.Rank] -- right mouse button – in the Merge Column interface – to set the information at the yellow label.
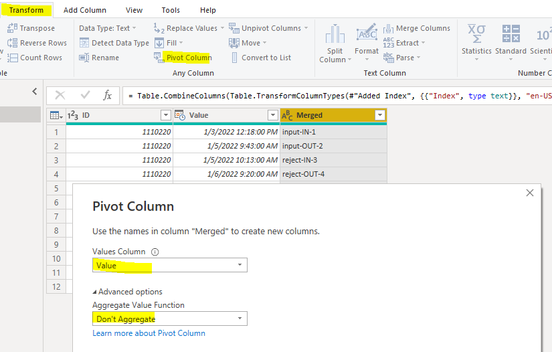
7. Select [Merged] -- Transform – Pivot Column.
Value Column -- [Custom.Value].
Advanced options – Don’t Aggregate.
8. Result:
Best Regards,
Liu Yang
If this post helps, then please consider Accept it as the solution to help the other members find it more quickly
- Mark as New
- Bookmark
- Subscribe
- Mute
- Subscribe to RSS Feed
- Permalink
- Report Inappropriate Content
Hi,
This is really helpful - I have a follow up requirement though and wanted to ask thoughts on this! If you wanted the number appended on to the new columns to be more consistent (i.e. IN 1, OUT 1, IN 2, OUT 2) how would you do this without going through and manually renaming columns (as your number of columns is dynamic)?
Many thanks! 😊
- Mark as New
- Bookmark
- Subscribe
- Mute
- Subscribe to RSS Feed
- Permalink
- Report Inappropriate Content
Great, thanks
- Mark as New
- Bookmark
- Subscribe
- Mute
- Subscribe to RSS Feed
- Permalink
- Report Inappropriate Content
Hi @Anonymous,
Great it's working now as expected ..
Thanks,
MS
- Mark as New
- Bookmark
- Subscribe
- Mute
- Subscribe to RSS Feed
- Permalink
- Report Inappropriate Content
Hi @MSuser5 ,
Here are the steps you can follow:
1. Go to Power Query – check [IN], [Out] – Unpivot Columns.
Result:
2. Add Column – Index Column – From 1.
3. Select the three columns [Process], [Attribute], [Index] -- right mouse button – in the Merge Column interface – to set the information at the yellow label.
4. Select [Merged] -- Transform – Pivot Column.
Value Column -- [Value].
Advanced options – Don’t Aggregate.
5. Result:
Best Regards,
Liu Yang
If this post helps, then please consider Accept it as the solution to help the other members find it more quickly
- Mark as New
- Bookmark
- Subscribe
- Mute
- Subscribe to RSS Feed
- Permalink
- Report Inappropriate Content
Hi @Anonymous ,
when we have bulk data index creating till the values ... its not getting appending the ID level data attached sample test file kindly check and suggest how to achive only process level should be 6 columns only.
PBIX file https://drive.google.com/file/d/15FZYD9A0dq-PJwFfpNRi1qMeA9AF2lZE/view?usp=sharing
i have around 100 ID records hence it's generating 100 process level columns.
but it should be only 6 columns
Thanks
- Mark as New
- Bookmark
- Subscribe
- Mute
- Subscribe to RSS Feed
- Permalink
- Report Inappropriate Content
Based on your sample data, which six columns would you expect to see?
- Mark as New
- Bookmark
- Subscribe
- Mute
- Subscribe to RSS Feed
- Permalink
- Report Inappropriate Content
Please do not do that. It is the opposite of what Power BI is about. You can easily show the data in a matrix visual like that (although I would also recommend you reconsider) but please don't do that. Quite the opposite, you should unpivot your data even more
ID | Process | Type | Date
Helpful resources

Power BI Monthly Update - November 2025
Check out the November 2025 Power BI update to learn about new features.

Fabric Data Days
Advance your Data & AI career with 50 days of live learning, contests, hands-on challenges, study groups & certifications and more!


