Jumpstart your career with the Fabric Career Hub
Find everything you need to get certified on Fabric—skills challenges, live sessions, exam prep, role guidance, and more.
Get started- Power BI forums
- Updates
- News & Announcements
- Get Help with Power BI
- Desktop
- Service
- Report Server
- Power Query
- Mobile Apps
- Developer
- DAX Commands and Tips
- Custom Visuals Development Discussion
- Health and Life Sciences
- Power BI Spanish forums
- Translated Spanish Desktop
- Power Platform Integration - Better Together!
- Power Platform Integrations (Read-only)
- Power Platform and Dynamics 365 Integrations (Read-only)
- Training and Consulting
- Instructor Led Training
- Dashboard in a Day for Women, by Women
- Galleries
- Community Connections & How-To Videos
- COVID-19 Data Stories Gallery
- Themes Gallery
- Data Stories Gallery
- R Script Showcase
- Webinars and Video Gallery
- Quick Measures Gallery
- 2021 MSBizAppsSummit Gallery
- 2020 MSBizAppsSummit Gallery
- 2019 MSBizAppsSummit Gallery
- Events
- Ideas
- Custom Visuals Ideas
- Issues
- Issues
- Events
- Upcoming Events
- Community Blog
- Power BI Community Blog
- Custom Visuals Community Blog
- Community Support
- Community Accounts & Registration
- Using the Community
- Community Feedback
Grow your Fabric skills and prepare for the DP-600 certification exam by completing the latest Microsoft Fabric challenge.
- Power BI forums
- Forums
- Get Help with Power BI
- Desktop
- Re: calculation to show value for NOT variable
- Subscribe to RSS Feed
- Mark Topic as New
- Mark Topic as Read
- Float this Topic for Current User
- Bookmark
- Subscribe
- Printer Friendly Page
- Mark as New
- Bookmark
- Subscribe
- Mute
- Subscribe to RSS Feed
- Permalink
- Report Inappropriate Content
calculation to show value for NOT variable
Hello,
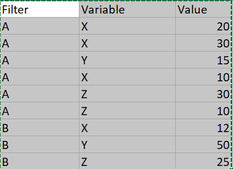
I'm trying to create a measure to show a calculation for values other than the variable indicated in the row label. For instance, in the data below (Table), I want to be able to do a calculation for X, but also show the calculation for all NOT-X, Calculate for Y and show all NOT-Y, etc.


Thank you,
J
Solved! Go to Solution.
- Mark as New
- Bookmark
- Subscribe
- Mute
- Subscribe to RSS Feed
- Permalink
- Report Inappropriate Content
Using the data table you provided, you can create two measures to get the desired result:
# Avg Value = AVERAGE(FilterTable[Value])# Avg Not Value =
VAR ThisVariable = MAX(FilterTable[Variable])
RETURN
CALCULATE(
[# Avg Value],
FILTER(
ALL(FilterTable),
NOT(FilterTable[Variable] = ThisVariable)
),
VALUES(FilterTable[Filter])
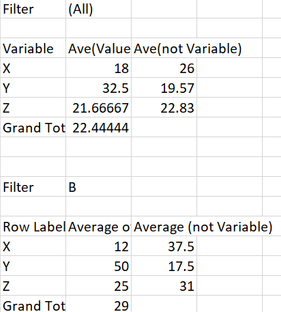
)Here are the results when no Filter slicer is applied:
And with the Filter slicer:
Please accept this as the solution if this solves your problem.
- Mark as New
- Bookmark
- Subscribe
- Mute
- Subscribe to RSS Feed
- Permalink
- Report Inappropriate Content
@AUaero Is there a solution if I am being asked to add a second filter (Filter2) to this table? With 2 filters, the Not Value calculation should still calculate based on the values remaining after the filters have been selected.
(I also noticed that my example for Filter B, Variable Y should have an Avg Not Value of 18.5. Thank you for correcting that oversight.)
Thank you.
Helpful resources
| User | Count |
|---|---|
| 88 | |
| 72 | |
| 69 | |
| 65 | |
| 57 |
| User | Count |
|---|---|
| 95 | |
| 93 | |
| 91 | |
| 75 | |
| 69 |


