Get Fabric or SQL Certified for Free.
Get certified for free when you join Fabric Data Days 2026 and dive into Fabric, Power BI, SQL, AI, and other essential data skills.
Join now- Power BI forums
- Get Help with Power BI
- Desktop
- Service
- Report Server
- Power Query
- Mobile Apps
- Developer
- DAX Commands and Tips
- Custom Visuals Development Discussion
- Health and Life Sciences
- Power BI Spanish forums
- Translated Spanish Desktop
- Training and Consulting
- Instructor Led Training
- Dashboard in a Day for Women, by Women
- Galleries
- Data Stories Gallery
- Themes Gallery
- Contests Gallery
- QuickViz Gallery
- Quick Measures Gallery
- Visual Calculations Gallery
- Fabric Apps Gallery
- Notebook Gallery
- Translytical Task Flow Gallery
- TMDL Gallery
- R Script Showcase
- Webinars and Video Gallery
- Ideas
- Custom Visuals Ideas (read-only)
- Issues
- Issues
- Events
- Upcoming Events
July 7 - July 17 | Round 2 of the Power BI Dataviz World Championships. Don't miss your chance! Learn more
- Power BI forums
- Forums
- Get Help with Power BI
- Desktop
- Re: average null values
- Subscribe to RSS Feed
- Mark Topic as New
- Mark Topic as Read
- Float this Topic for Current User
- Bookmark
- Subscribe
- Printer Friendly Page

- Mark as New
- Bookmark
- Subscribe
- Mute
- Subscribe to RSS Feed
- Permalink
- Report Inappropriate Content
average null values
Hello,
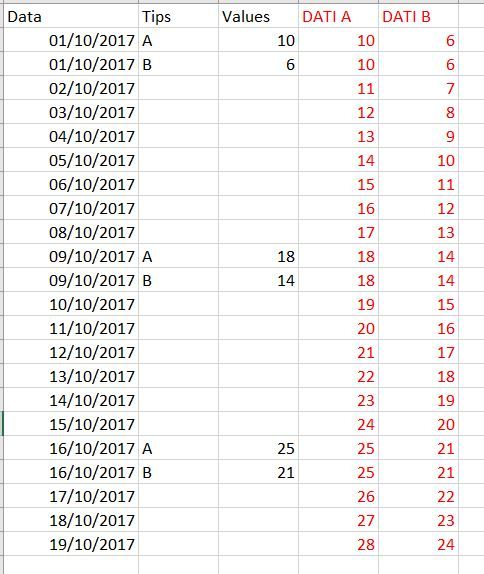
can someone help me on how can I get the result highlighted in red?
GRAZIE
Solved! Go to Solution.
- Mark as New
- Bookmark
- Subscribe
- Mute
- Subscribe to RSS Feed
- Permalink
- Report Inappropriate Content
Please see attached pbix with both a Power Query and DAX (Measure) solution. The logic for both:
- Use the value for the day if there is one.
- Otherwise, find out the previous and next values and calculate the weighted average.
Power Query script:
Note: This script is run for each Tip through a Function which passes the Tip as a parameter.
let
    Source = Table.SelectRows(#"Missing", each [Tips] = Tip),
    #"Sorted Rows" = Table.Sort(Source,{{"Date", Order.Ascending}}),
    #"Added Index" = Table.AddIndexColumn(#"Sorted Rows", "Index", 0, 1),
    ListValues = #"Added Index"[Original Value],
    Accumulator = List.Skip(List.Accumulate(
        ListValues,
        {0},
        (Accumulated, Current) =>
            Accumulated &
            {List.Last(Accumulated) + (if Current = null then 0 else 1)}
        )
    ),
    AddIndex = Table.AddColumn(#"Added Index", "Grouping", each Accumulator{[Index]}),
    #"Removed Columns" = Table.RemoveColumns(AddIndex,{"Index"}),
    #"Grouped Rows" = Table.Group(#"Removed Columns", {"Grouping"}, {{"MinDate", each List.Min([Date]), type date}, {"Value", each List.Max([Original Value]), type number}}),
    Merged = Table.NestedJoin(#"Removed Columns", {"Grouping"}, #"Grouped Rows", {"Grouping"}, "Table", JoinKind.Inner),
    #"Expanded Table" = Table.ExpandTableColumn(Merged, "Table", {"MinDate", "Value"}, {"PrevDate", "PrevValue"}),
    AddNextGrouping = Table.AddColumn(#"Expanded Table", "GroupingNext", each [Grouping] + 1),
    Merged2 = Table.NestedJoin(AddNextGrouping, {"GroupingNext"}, #"Grouped Rows", {"Grouping"}, "Table", JoinKind.LeftOuter),
    #"Expanded Table1" = Table.ExpandTableColumn(Merged2, "Table", {"MinDate", "Value"}, {"NextDate", "NextValue"}),
    #"Removed Columns1" = Table.RemoveColumns(#"Expanded Table1",{"Grouping", "GroupingNext"}),
    DaysBetweenValues = Table.AddColumn(#"Removed Columns1", "Days Between Values", each Duration.Days([NextDate]-[PrevDate])),
    #"Added Custom" = Table.AddColumn(DaysBetweenValues, "Days Since Prev Value", each Duration.Days([Date]-[PrevDate])),
    #"Added Custom 2"= Table.AddColumn(#"Added Custom", "Days Until Next Value", each Duration.Days([NextDate]-[Date])),
    #"Added Custom1" = Table.AddColumn(#"Added Custom 2", "Value", each if [Original Value] = null then (([Days Between Values]-[Days Since Prev Value]) * [PrevValue] + ([Days Between Values]- [Days Until Next Value]) * [NextValue]) / [Days Between Values] else [Original Value]),
    #"Removed Columns2" = Table.RemoveColumns(#"Added Custom1",{"Original Value", "PrevDate", "PrevValue", "NextDate", "NextValue", "Days Between Values", "Days Since Prev Value", "Days Until Next Value"})
in
    #"Removed Columns2"
DAX Measure:
Calculated Value - DAX =
IF(
    ISBLANK([Original Value - Measure]),
    var _date = SELECTEDVALUE('Date'[Date])
    var _prev_date = LASTNONBLANK(
        FILTER(
            ALL('Date'[Date]),
            'Date'[Date] <= _date
        ),
        [Original Value - Measure]
    )
    var _next_date = FIRSTNONBLANK(
        FILTER(
            ALL('Date'[Date]),
            'Date'[Date] >= _date
        ),
        [Original Value - Measure]
    )
    var _prev_value = CALCULATE([Original Value - Measure], 'Date'[Date] = _prev_date)
    var _next_value = CALCULATE([Original Value - Measure], 'Date'[Date] = _next_date)
    var _days_between_values = DATEDIFF(_prev_date, _next_date, DAY)
    var _days_since_value = DATEDIFF(_prev_date, _date, DAY)
    var _days_until_value = _days_between_values - _days_since_value
    return
        DIVIDE(
            (_days_between_values-_days_since_value) * _prev_value
            +
            (_days_between_values-_days_until_value) * _next_value,
            _days_between_values
        ),
    [Original Value - Measure]
)
I also appreciate Kudos.

- Mark as New
- Bookmark
- Subscribe
- Mute
- Subscribe to RSS Feed
- Permalink
- Report Inappropriate Content
@faridelmjabber - Could you please describe the business logic used to come up with the red numbers?
- Mark as New
- Bookmark
- Subscribe
- Mute
- Subscribe to RSS Feed
- Permalink
- Report Inappropriate Content
@Anonymous
I would like to fill in empty cells with an incremental average value, example:
if I have the first value 10 and after 3 empty cells you can have another value than 16, the furmula should be:
16-10= 6 6/4= 1.5
so we will have:
10
10 + 1.5 = 11.5 first empty cell
10 + 1.5 + 1.5 = 13 second empty cell
10 + 1.5 + 1.5 + 1.5 = 14.5 third empty cell
16
ask me for poor English as I use google translator
- Mark as New
- Bookmark
- Subscribe
- Mute
- Subscribe to RSS Feed
- Permalink
- Report Inappropriate Content
Please see attached pbix with both a Power Query and DAX (Measure) solution. The logic for both:
- Use the value for the day if there is one.
- Otherwise, find out the previous and next values and calculate the weighted average.
Power Query script:
Note: This script is run for each Tip through a Function which passes the Tip as a parameter.
let
    Source = Table.SelectRows(#"Missing", each [Tips] = Tip),
    #"Sorted Rows" = Table.Sort(Source,{{"Date", Order.Ascending}}),
    #"Added Index" = Table.AddIndexColumn(#"Sorted Rows", "Index", 0, 1),
    ListValues = #"Added Index"[Original Value],
    Accumulator = List.Skip(List.Accumulate(
        ListValues,
        {0},
        (Accumulated, Current) =>
            Accumulated &
            {List.Last(Accumulated) + (if Current = null then 0 else 1)}
        )
    ),
    AddIndex = Table.AddColumn(#"Added Index", "Grouping", each Accumulator{[Index]}),
    #"Removed Columns" = Table.RemoveColumns(AddIndex,{"Index"}),
    #"Grouped Rows" = Table.Group(#"Removed Columns", {"Grouping"}, {{"MinDate", each List.Min([Date]), type date}, {"Value", each List.Max([Original Value]), type number}}),
    Merged = Table.NestedJoin(#"Removed Columns", {"Grouping"}, #"Grouped Rows", {"Grouping"}, "Table", JoinKind.Inner),
    #"Expanded Table" = Table.ExpandTableColumn(Merged, "Table", {"MinDate", "Value"}, {"PrevDate", "PrevValue"}),
    AddNextGrouping = Table.AddColumn(#"Expanded Table", "GroupingNext", each [Grouping] + 1),
    Merged2 = Table.NestedJoin(AddNextGrouping, {"GroupingNext"}, #"Grouped Rows", {"Grouping"}, "Table", JoinKind.LeftOuter),
    #"Expanded Table1" = Table.ExpandTableColumn(Merged2, "Table", {"MinDate", "Value"}, {"NextDate", "NextValue"}),
    #"Removed Columns1" = Table.RemoveColumns(#"Expanded Table1",{"Grouping", "GroupingNext"}),
    DaysBetweenValues = Table.AddColumn(#"Removed Columns1", "Days Between Values", each Duration.Days([NextDate]-[PrevDate])),
    #"Added Custom" = Table.AddColumn(DaysBetweenValues, "Days Since Prev Value", each Duration.Days([Date]-[PrevDate])),
    #"Added Custom 2"= Table.AddColumn(#"Added Custom", "Days Until Next Value", each Duration.Days([NextDate]-[Date])),
    #"Added Custom1" = Table.AddColumn(#"Added Custom 2", "Value", each if [Original Value] = null then (([Days Between Values]-[Days Since Prev Value]) * [PrevValue] + ([Days Between Values]- [Days Until Next Value]) * [NextValue]) / [Days Between Values] else [Original Value]),
    #"Removed Columns2" = Table.RemoveColumns(#"Added Custom1",{"Original Value", "PrevDate", "PrevValue", "NextDate", "NextValue", "Days Between Values", "Days Since Prev Value", "Days Until Next Value"})
in
    #"Removed Columns2"
DAX Measure:
Calculated Value - DAX =
IF(
    ISBLANK([Original Value - Measure]),
    var _date = SELECTEDVALUE('Date'[Date])
    var _prev_date = LASTNONBLANK(
        FILTER(
            ALL('Date'[Date]),
            'Date'[Date] <= _date
        ),
        [Original Value - Measure]
    )
    var _next_date = FIRSTNONBLANK(
        FILTER(
            ALL('Date'[Date]),
            'Date'[Date] >= _date
        ),
        [Original Value - Measure]
    )
    var _prev_value = CALCULATE([Original Value - Measure], 'Date'[Date] = _prev_date)
    var _next_value = CALCULATE([Original Value - Measure], 'Date'[Date] = _next_date)
    var _days_between_values = DATEDIFF(_prev_date, _next_date, DAY)
    var _days_since_value = DATEDIFF(_prev_date, _date, DAY)
    var _days_until_value = _days_between_values - _days_since_value
    return
        DIVIDE(
            (_days_between_values-_days_since_value) * _prev_value
            +
            (_days_between_values-_days_until_value) * _next_value,
            _days_between_values
        ),
    [Original Value - Measure]
)
I also appreciate Kudos.
- Mark as New
- Bookmark
- Subscribe
- Mute
- Subscribe to RSS Feed
- Permalink
- Report Inappropriate Content
@Anonymous
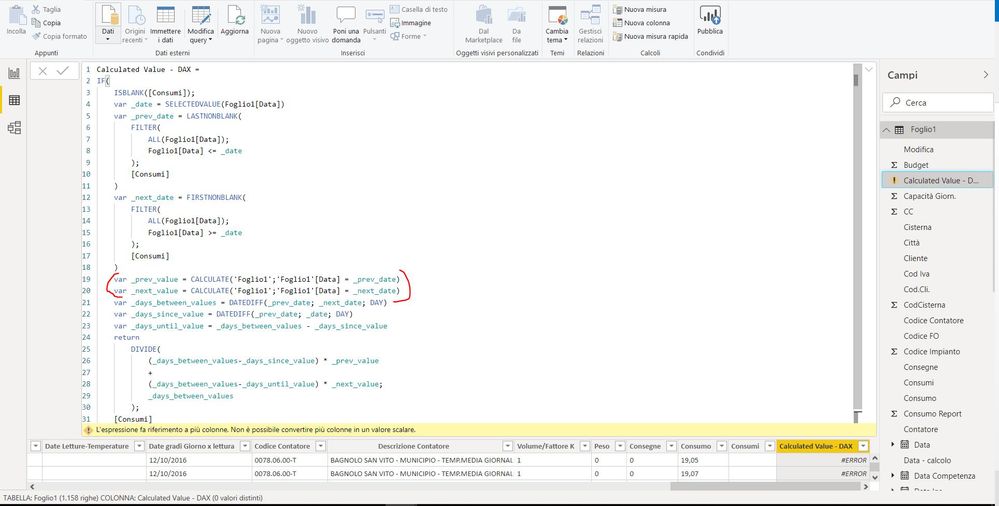
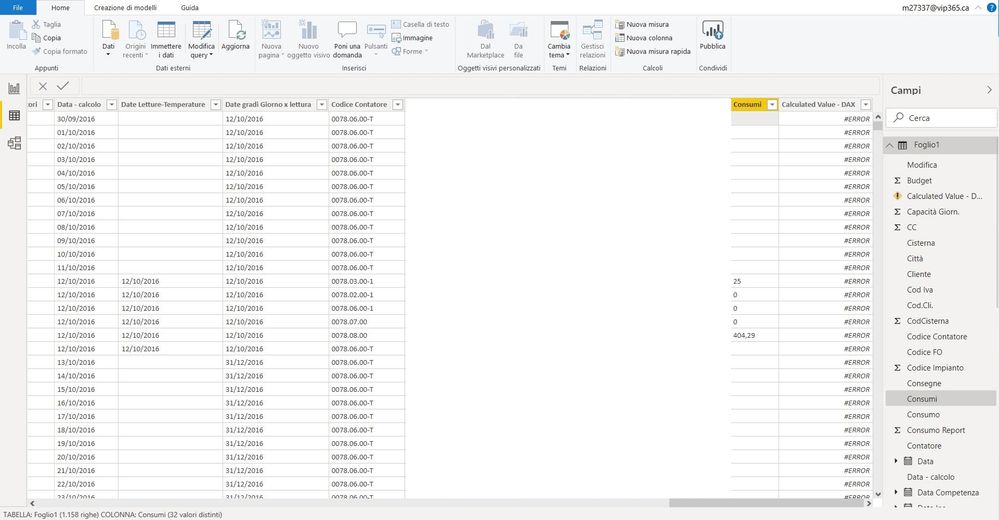
thanks for the reply, I can't apply your suggestion,
I have just a table, where am I doing wrong?
suppose I would like to get the calculate the weighted average only for lines A (in my case it is the column (codice contatore))
thanks
- Mark as New
- Bookmark
- Subscribe
- Mute
- Subscribe to RSS Feed
- Permalink
- Report Inappropriate Content
@faridelmjabber - Is it possible to add a date table? This solution depends on it.
- Mark as New
- Bookmark
- Subscribe
- Mute
- Subscribe to RSS Feed
- Permalink
- Report Inappropriate Content
@Anonymous
I tried to create a new date table, it gives me the same problem, you can give me some suggestions please
thanks
Helpful resources

FabCon & SQLCon – Barcelona 2026
Join us in Barcelona for FabCon and SQLCon, the Fabric, Power BI, SQL, and AI community event. Save €200 with code FABCMTY200.

Data Days 2026
Join Data Days 2026: 60 days of free live/on-demand sessions, challenges, study groups, and certification opportunities.

Power BI DataViz World Championships - June 2026
A new Power BI DataViz World Championship is coming this June! Don't miss out on submitting your entry.

| User | Count |
|---|---|
| 29 | |
| 28 | |
| 27 | |
| 27 | |
| 19 |


| User | Count |
|---|---|
| 56 | |
| 47 | |
| 39 | |
| 28 | |
| 21 |


