Get certified for free when you join Fabric Data Days 2026 and dive into Fabric, Power BI, SQL, AI, and other essential data skills.
Join nowJuly 7 - July 17 | Round 2 of the Power BI Dataviz World Championships. Don't miss your chance! Learn more
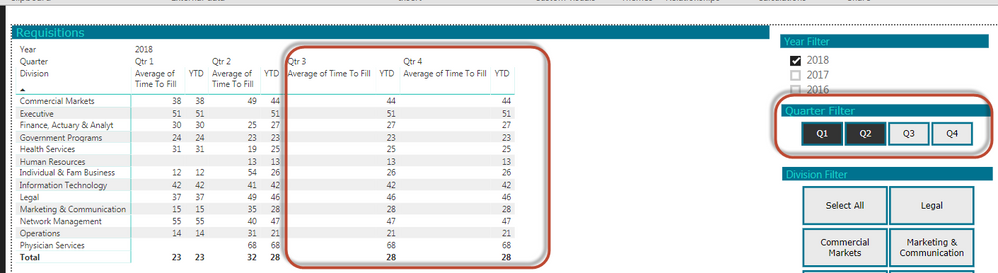
I created a YTD measure that is calculating YTD numbers throughout the entire year as it should. However, since I have added this measure to my visual, my slicer will no longer filter down to just display the quarter that I select. . Is there anyway to stop this from happening. See below. I have only quarter 1 and 2 selected but the visual still displays the YTD measure for Q3 and Q4. I used a YTD quick measure which is :
YTD =
IF(
ISFILTERED('1. Date'[Date]),
ERROR("Time intelligence quick measures can only be grouped or filtered by the Power BI-provided date hierarchy or primary date column."),
TOTALYTD(
AVERAGE('Filled Positions'[Time To Fill]),
'1. Date'[Date].[Date]
)
)
Hi @ahoium
I'm stuck when reproducing your problem.
Is the result of YTD measure correct as you expected?
Which column do you add to the quarter slicer?
How do you create the relationship between the table where this column (added to the quarter slicer) lies and the table 'Filled Positions'?
Without detailed information, i can't give a proper solution for your problem.
Anyway, you could try this workaround.
Create a measure as below
measure1=IF(ISBLANK([average of time fill]),BLANK())
add this measure in the Visual Level filter of this matrix, set "show items when value" is not blank.
Best Regards
Maggie
Join us in Barcelona for FabCon and SQLCon, the Fabric, Power BI, SQL, and AI community event. Save €200 with code FABCMTY200.
Join Data Days 2026: 60 days of free live/on-demand sessions, challenges, study groups, and certification opportunities.
| User | Count |
|---|---|
| 29 | |
| 27 | |
| 26 | |
| 24 | |
| 16 |
| User | Count |
|---|---|
| 53 | |
| 47 | |
| 39 | |
| 31 | |
| 21 |