FabCon is coming to Atlanta
Join us at FabCon Atlanta from March 16 - 20, 2026, for the ultimate Fabric, Power BI, AI and SQL community-led event. Save $200 with code FABCOMM.
Register now!- Power BI forums
- Get Help with Power BI
- Desktop
- Service
- Report Server
- Power Query
- Mobile Apps
- Developer
- DAX Commands and Tips
- Custom Visuals Development Discussion
- Health and Life Sciences
- Power BI Spanish forums
- Translated Spanish Desktop
- Training and Consulting
- Instructor Led Training
- Dashboard in a Day for Women, by Women
- Galleries
- Data Stories Gallery
- Themes Gallery
- Contests Gallery
- QuickViz Gallery
- Quick Measures Gallery
- Visual Calculations Gallery
- Notebook Gallery
- Translytical Task Flow Gallery
- TMDL Gallery
- R Script Showcase
- Webinars and Video Gallery
- Ideas
- Custom Visuals Ideas (read-only)
- Issues
- Issues
- Events
- Upcoming Events
The Power BI Data Visualization World Championships is back! It's time to submit your entry. Live now!
- Power BI forums
- Forums
- Get Help with Power BI
- Desktop
- Water fall chart visualization help
- Subscribe to RSS Feed
- Mark Topic as New
- Mark Topic as Read
- Float this Topic for Current User
- Bookmark
- Subscribe
- Printer Friendly Page
- Mark as New
- Bookmark
- Subscribe
- Mute
- Subscribe to RSS Feed
- Permalink
- Report Inappropriate Content
Water fall chart visualization help
Hello everyone!
I am having some trouble with the waterfall chart and i would really appreciate your help 🙂
My data set consist on forecast data for 2021 in different quarters. I take a snapshot every month (extraction date) to the forecast to analyse fluctuation (202010 is the forecast snapshot of October 2020 , 202011 is November, and so on).
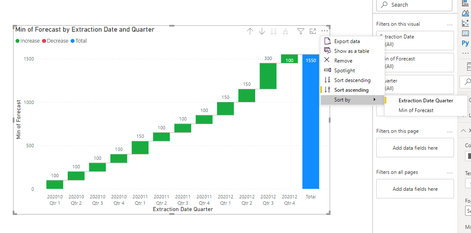
As a result, i can create a waterfall chart and see the increases in the total forecast, but i cannot arrange the quarters properly. See picture below, from 202011 to 202012 extraction dates, it shows the following order: qtr3 , qtr2 , qtr1 , qtr4. When i want to see the proper order: qtr1 , qtr 2, qtr 3, qtr4, independently of the variances volumes.
Table 1. dataset
Extraction Date | Forecast | Year | Quarter |
202010 | 100 | 2021 | Qtr 1 |
202010 | 100 | 2021 | Qtr 2 |
202010 | 100 | 2021 | Qtr 3 |
202010 | 100 | 2021 | Qtr 4 |
202011 | 150 | 2021 | Qtr 1 |
202011 | 100 | 2021 | Qtr 2 |
202011 | 100 | 2021 | Qtr 3 |
202011 | 100 | 2021 | Qtr 4 |
202012 | 150 | 2021 | Qtr 1 |
202012 | 150 | 2021 | Qtr 2 |
202012 | 300 | 2021 | Qtr 3 |
202012 | 100 | 2021 | Qtr 4 |
Waterfall result: Arrange by extraction date but cant arrange quarters...
Thanks! 🙂
Juampi
Solved! Go to Solution.
- Mark as New
- Bookmark
- Subscribe
- Mute
- Subscribe to RSS Feed
- Permalink
- Report Inappropriate Content
Hi @Juampi ,
Put the field in the right position, and then sort by Extraction Date can get the desired sort result:
If you don’t understand this, there are official documents here for reference:
Sort by column in Power BI Desktop - Power BI | Microsoft Docs
If the problem is still not resolved, please provide detailed error information. Let me know immediately, looking forward to your reply.
Best Regards,
Henry
If this post helps, then please consider Accept it as the solution to help the other members find it more quickly.
- Mark as New
- Bookmark
- Subscribe
- Mute
- Subscribe to RSS Feed
- Permalink
- Report Inappropriate Content
Hi! I am looking to build a waterfall chart to have a starting point of 2022, adding in a category breakdown of "Baseline Refinery", having a new total bar, then having the supplimental step changes to get to 2023. Please help!
| 2022 | 77,400,000 | Budget |
| 2023 | 27,000,000 | Catch-up |
| 2023 | 13,600,000 | One-Off |
| 2023 | 2,800,000 | Baseline Refinery |
| 2023 | 1,800,000 | SMTMM |
| 2023 | 122,600,000 | Budget |
- Mark as New
- Bookmark
- Subscribe
- Mute
- Subscribe to RSS Feed
- Permalink
- Report Inappropriate Content
Hi @Juampi ,
Put the field in the right position, and then sort by Extraction Date can get the desired sort result:
If you don’t understand this, there are official documents here for reference:
Sort by column in Power BI Desktop - Power BI | Microsoft Docs
If the problem is still not resolved, please provide detailed error information. Let me know immediately, looking forward to your reply.
Best Regards,
Henry
If this post helps, then please consider Accept it as the solution to help the other members find it more quickly.
- Mark as New
- Bookmark
- Subscribe
- Mute
- Subscribe to RSS Feed
- Permalink
- Report Inappropriate Content
Hi Juampi,
This topic covers a similar question: https://community.powerbi.com/t5/Desktop/Waterfall-chart-to-show-product-availability/m-p/1642428#M6...
I think editing the sort by option should work in your case as well.
Hope it helps!
Regards,
Tim
Did I answer your question? Mark my post as a solution!
Proud to be a Super User!
Helpful resources
| User | Count |
|---|---|
| 51 | |
| 38 | |
| 33 | |
| 22 | |
| 19 |
| User | Count |
|---|---|
| 136 | |
| 102 | |
| 59 | |
| 36 | |
| 35 |


