Get Fabric or SQL Certified for Free.
Get certified for free when you join Fabric Data Days 2026 and dive into Fabric, Power BI, SQL, AI, and other essential data skills.
Join now- Power BI forums
- Get Help with Power BI
- Desktop
- Service
- Report Server
- Power Query
- Mobile Apps
- Developer
- DAX Commands and Tips
- Custom Visuals Development Discussion
- Health and Life Sciences
- Power BI Spanish forums
- Translated Spanish Desktop
- Training and Consulting
- Instructor Led Training
- Dashboard in a Day for Women, by Women
- Galleries
- Data Stories Gallery
- Themes Gallery
- Contests Gallery
- QuickViz Gallery
- Quick Measures Gallery
- Visual Calculations Gallery
- Fabric Apps Gallery
- Notebook Gallery
- Translytical Task Flow Gallery
- TMDL Gallery
- R Script Showcase
- Webinars and Video Gallery
- Ideas
- Custom Visuals Ideas (read-only)
- Issues
- Issues
- Events
- Upcoming Events
July 28 - August 9 | Final Round of the Power BI Dataviz World Championships. This is your chance. Learn more
- Power BI forums
- Forums
- Get Help with Power BI
- Desktop
- Re: Vlookup for Text between multiple data sets
- Subscribe to RSS Feed
- Mark Topic as New
- Mark Topic as Read
- Float this Topic for Current User
- Bookmark
- Subscribe
- Printer Friendly Page

- Mark as New
- Bookmark
- Subscribe
- Mute
- Subscribe to RSS Feed
- Permalink
- Report Inappropriate Content
Vlookup for Text between multiple data sets
Hi All,
I'm sure I'm missing something incredibly obvious, but I'm struggling to perform a VLOOKUP type function between a 2 sets of data. The first is a live pull from our CRM system that I need to create a new column in to pull in a Region. Currently I just have a Sales Person. The second source, is a flat file that is literally 2 columns: Owner (Sales Person) and Region. I have tried the LOOKUPVALUE function within PowerBI, but I keep getting an error regarding non-numerical values which is very frustrating. Any pointers would be greatly appreciated! Below is some sample data. Thank you so much for your help!
Table1
| Sales Person |
| John Smith |
| James Person |
| Frank Brown |
Table 2
| Owner | Region |
| John Smith | Americas |
| James Person | Europe |
| Frank Brown | Asia |
Solved! Go to Solution.


- Mark as New
- Bookmark
- Subscribe
- Mute
- Subscribe to RSS Feed
- Permalink
- Report Inappropriate Content
Is this what you want?

Regards
Amine Jerbi
If I answered your question, please mark this thread as accepted
and you can follow me on
My Website, LinkedIn and Facebook
- Mark as New
- Bookmark
- Subscribe
- Mute
- Subscribe to RSS Feed
- Permalink
- Report Inappropriate Content
I checked to confirm that all of the values I'm pulling are text. This is the error that I keep getting:

Not sure how to get around this one...

- Mark as New
- Bookmark
- Subscribe
- Mute
- Subscribe to RSS Feed
- Permalink
- Report Inappropriate Content
@GRikerWillig can you try this relationship-proof column
Column= CALCULATE(MAXX(FILTER('Table 2','Table 2'[Owner]=max('Table 1'[Sales Person])),'Table 2'[Region]))

========================
Did I answer your question? Mark my post as a solution!
Proud to be a Super User
My Custom Visualization Projects
• Plotting Live Sound: Live Sound
• Beautiful News: Women in Parliament, Energy Mix, Shrinking Armies
• Visual Capitalist: Working Hrs
• Others: Easing Graph, Animated Calendar
MayViz Submissions
• Week 1: View
• Week 2: View
• Week 3: View
• Week 4: View
========================


- Mark as New
- Bookmark
- Subscribe
- Mute
- Subscribe to RSS Feed
- Permalink
- Report Inappropriate Content
@GRikerWillig
Make sure you have the same data type used the LOOKVALUE function correctly, can you the dax formula ?
https://dax.guide/lookupvalue/
⭕ Subscribe and learn Power BI from these videos
⚪ Website ⚪ LinkedIn ⚪ PBI User Group
- Mark as New
- Bookmark
- Subscribe
- Mute
- Subscribe to RSS Feed
- Permalink
- Report Inappropriate Content
Got it! Looks like I was creating a measure instead of a new column which explains the error. Thank you so much for your help!
- Mark as New
- Bookmark
- Subscribe
- Mute
- Subscribe to RSS Feed
- Permalink
- Report Inappropriate Content
I checked to confirm that all of the values I'm pulling are text. This is the error that I keep getting:
Not sure how to get around this one...
- Mark as New
- Bookmark
- Subscribe
- Mute
- Subscribe to RSS Feed
- Permalink
- Report Inappropriate Content
Is this what you want?
Regards
Amine Jerbi
If I answered your question, please mark this thread as accepted
and you can follow me on
My Website, LinkedIn and Facebook
- Mark as New
- Bookmark
- Subscribe
- Mute
- Subscribe to RSS Feed
- Permalink
- Report Inappropriate Content
Looks like I was creating a measure instead of a column which was the cause of my difficulties. Thank you so much for your patience and help!
- Mark as New
- Bookmark
- Subscribe
- Mute
- Subscribe to RSS Feed
- Permalink
- Report Inappropriate Content
I thought so, But you made it.
Welcome
Regards
Amine Jerbi
If I answered your question, please mark this thread as accepted
and you can follow me on
My Website, LinkedIn and Facebook
- Mark as New
- Bookmark
- Subscribe
- Mute
- Subscribe to RSS Feed
- Permalink
- Report Inappropriate Content
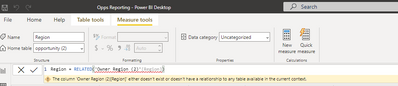
It definitely would be if I could get it to work 😞 I have already confirmed that there IS a relationship created between the tables, I started there first, but when I started typing in the related function, no Table/Column combos populated so is it possible that I entered it incorrectly somehow?
- Mark as New
- Bookmark
- Subscribe
- Mute
- Subscribe to RSS Feed
- Permalink
- Report Inappropriate Content
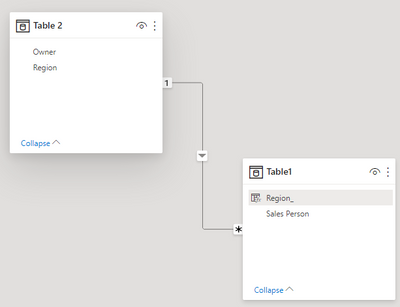
The relashionship between tables is it this way?
Regards
Amine Jerbi
If I answered your question, please mark this thread as accepted
and you can follow me on
My Website, LinkedIn and Facebook
- Mark as New
- Bookmark
- Subscribe
- Mute
- Subscribe to RSS Feed
- Permalink
- Report Inappropriate Content
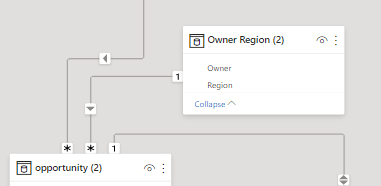
It is. There are a bunch of other tables attached to each other in the backround, but those 2 are directly connected.

Helpful resources

FabCon & SQLCon – Barcelona 2026
Join us in Barcelona for FabCon and SQLCon, the Fabric, Power BI, SQL, and AI community event. Save €200 with code FABCMTY200.

Fabric Community Sticker Challenge - Barcelona 2026
If you love stickers, then you will definitely want to check out our community sticker challenge, Barcelona edition!

Power BI Monthly Update - July 2026
Check out the July 2026 Power BI update to learn about new features.

Power BI DataViz World Championships - June 2026
A new Power BI DataViz World Championship is coming this June! Don't miss out on submitting your entry.

| User | Count |
|---|---|
| 30 | |
| 28 | |
| 24 | |
| 23 | |
| 17 |


| User | Count |
|---|---|
| 46 | |
| 32 | |
| 17 | |
| 17 | |
| 16 |


