Join the #PBI10 DataViz contest
Power BI is turning 10, and we’re marking the occasion with a special community challenge. Use your creativity to tell a story, uncover trends, or highlight something unexpected.
Get started- Power BI forums
- Get Help with Power BI
- Desktop
- Service
- Report Server
- Power Query
- Mobile Apps
- Developer
- DAX Commands and Tips
- Custom Visuals Development Discussion
- Health and Life Sciences
- Power BI Spanish forums
- Translated Spanish Desktop
- Training and Consulting
- Instructor Led Training
- Dashboard in a Day for Women, by Women
- Galleries
- Webinars and Video Gallery
- Data Stories Gallery
- Themes Gallery
- Contests Gallery
- Quick Measures Gallery
- Notebook Gallery
- Translytical Task Flow Gallery
- R Script Showcase
- Ideas
- Custom Visuals Ideas (read-only)
- Issues
- Issues
- Events
- Upcoming Events
Join us for an expert-led overview of the tools and concepts you'll need to become a Certified Power BI Data Analyst and pass exam PL-300. Register now.
- Power BI forums
- Forums
- Get Help with Power BI
- Desktop
- Visuals not updating after changing data in power ...
- Subscribe to RSS Feed
- Mark Topic as New
- Mark Topic as Read
- Float this Topic for Current User
- Bookmark
- Subscribe
- Printer Friendly Page
- Mark as New
- Bookmark
- Subscribe
- Mute
- Subscribe to RSS Feed
- Permalink
- Report Inappropriate Content
Visuals not updating after changing data in power query even if I click refresh
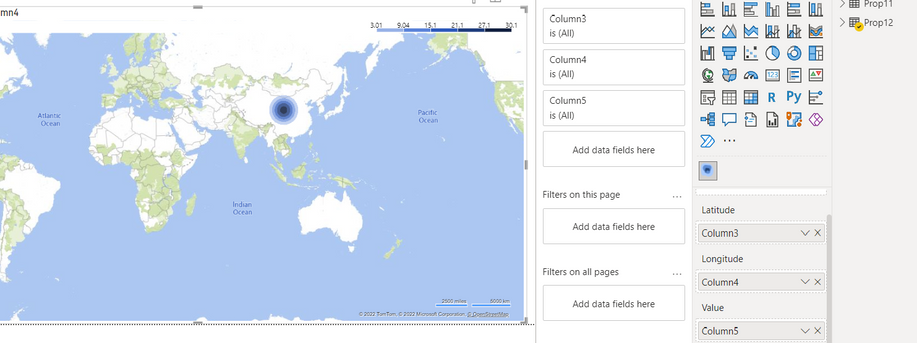
I have this dashboard. A screenshot of it is below:
This is a heatmap based off the dataset called Prop 12. Its columns give the values and longitudes and latitudes of the countries those values correspond to.
You will notice that on the top right side of the heat map there is legend which goes up to the value 30.1. This is the value corresponding to China.
I want to change that maximum value to 10 using powerquery and have the dashboard automatically update. Note no other countries have values bigger than one. So if I change China's value to 10, the legend should mention 10 rather than 30.1.
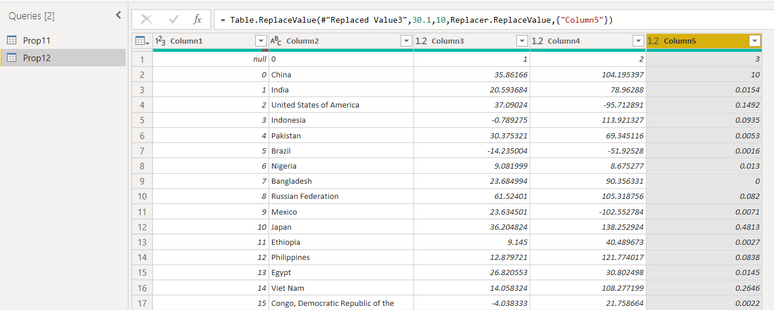
I change the value by going to 'transform data> Replace Values' and change the 30.1 in column 5 of Prop12 from 30.1 to 10.
In other words, the data set originally looked like:
It now looks like:
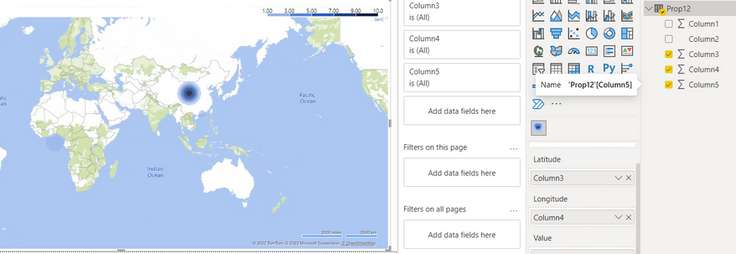
I hit close and apply. However the dashboard does not automatically update to show 10 as the maximum value in the legend. It still shows 30.1 as per the first screenshot. If I click on 'Refresh' which is within the home tab, still nothing happens. Is there a way to get the heatmap to automatically update or to update upon clicking on something like a refresh button. At the moment, the only way I can get the heatmap to show 10 as the maximum value on the legend is to remove 'Column 5' under Value at the bottom of the visualization pane and then redrag 'Column 5' from within 'Prop 12' back under 'Value' again. Is there a way to get the heatmap to update without this workaround. Below is a screenshot of what I want the heatmap to update to:
Here is the link to the report: https://drive.google.com/file/d/1saZTLipKLFdJdF2sr9Es_twgQ5Ama75Y/view?usp=sharing
Here is the link to the dataset on which the heatmap is built within the report:
https://drive.google.com/file/d/1E0aWMCECOWdsMTZFUPUMYaAS6dhUsrTU/view?usp=sharing
- Mark as New
- Bookmark
- Subscribe
- Mute
- Subscribe to RSS Feed
- Permalink
- Report Inappropriate Content
Have you tried reinstalling your Power BI Desktop app?
- Mark as New
- Bookmark
- Subscribe
- Mute
- Subscribe to RSS Feed
- Permalink
- Report Inappropriate Content
That's not a dashboard, it is a report.
Please provide sanitized sample data that fully covers your issue. I can only help you with meaningful sample data.
Please paste the data into a table in your post or use one of the file services like OneDrive or Google Drive. Screenshots of your source data are not useful.
Please show the expected outcome based on the sample data you provided. Screenshots of the expected outcome are ok.
https://community.powerbi.com/t5/Community-Blog/How-to-provide-sample-data-in-the-Power-BI-Forum/ba-...
https://community.powerbi.com/t5/Desktop/How-to-Get-Your-Question-Answered-Quickly/m-p/1447523
- Mark as New
- Bookmark
- Subscribe
- Mute
- Subscribe to RSS Feed
- Permalink
- Report Inappropriate Content
Here is the link to the report itself:
https://drive.google.com/file/d/1saZTLipKLFdJdF2sr9Es_twgQ5Ama75Y/view?usp=sharing
Here is the link to the underlying dataset that the heatmap within the report is based on:
https://drive.google.com/file/d/1E0aWMCECOWdsMTZFUPUMYaAS6dhUsrTU/view?usp=sharing
Latitude is column 3, longitude is column 4 and value is column 5. As I mentioned before I want to be able to change the value of an entry in the dataset using Powerquery and have the heatmap automatically update to reflect that change. For instance, if i change the entry in column 5 of the second row (the row with China in the second column) to 10: Then once I hit close and apply (and perhaps refresh) I want the heatmap to change to:
This is the right image because you can see 10 on the right hand side of the legend in the top right corner
- Mark as New
- Bookmark
- Subscribe
- Mute
- Subscribe to RSS Feed
- Permalink
- Report Inappropriate Content
access denied on both links
- Mark as New
- Bookmark
- Subscribe
- Mute
- Subscribe to RSS Feed
- Permalink
- Report Inappropriate Content
I accidentally had the wrong option ticked. It should work now: This is the dataset link:
https://drive.google.com/file/d/1E0aWMCECOWdsMTZFUPUMYaAS6dhUsrTU/view?usp=sharing
And this is the report link:
https://drive.google.com/file/d/1qXVDJVwccvrIBggvHy7RTlt5rLYHAjP0/view?usp=sharing
- Mark as New
- Bookmark
- Subscribe
- Mute
- Subscribe to RSS Feed
- Permalink
- Report Inappropriate Content
The visual works for me. There is a data quality issue where one country is "0"
You also didn't categorize columns 3 and 4 as Latitude and Longitude.
When I change the source data to assign the large value to another country it also works after the refresh.
see attached.
- Mark as New
- Bookmark
- Subscribe
- Mute
- Subscribe to RSS Feed
- Permalink
- Report Inappropriate Content
Dear Ibendlin,
Can you try the report without the table added on the left. Ie, like how I originally had it. Please tell me if the heatmap updates upon editing the data if you do not have the table present
- Mark as New
- Bookmark
- Subscribe
- Mute
- Subscribe to RSS Feed
- Permalink
- Report Inappropriate Content
I note that when I update the data, the visualization updates so long as I click on appropriate country in the table on the left. Otherwise it does not update
- Mark as New
- Bookmark
- Subscribe
- Mute
- Subscribe to RSS Feed
- Permalink
- Report Inappropriate Content
Hi @William29 ,
I open your shared pbix file, and the max value display as 10 on heat map. I didn't make any change or interaction in the report. The version of my Power BI Desktop is 2.108.603.0 64-bit (August 2022)...
Best Regards
- Mark as New
- Bookmark
- Subscribe
- Mute
- Subscribe to RSS Feed
- Permalink
- Report Inappropriate Content
Hello@lbendlin, and @Anonymous
I have updated the link so that the max value shown on the heatmap is 22. Please tell me what happens if you use Power query to change the value of 22 (on the 5th column with the row with china mentioned in second column) to 10. See if it automatically updates the max value on the visual to 10 after refresh. Try this without the table because I cant get it to work without table
- Mark as New
- Bookmark
- Subscribe
- Mute
- Subscribe to RSS Feed
- Permalink
- Report Inappropriate Content
Hi @Anonymous,
Have you tried altering the value from 10 (its the value of the 5th column for the row with china in it) to some other value to see if the visualizations update. I cant get it to work. It works when a table is placed next to the heatmap like @lbendlin used (so long as you click somewhere on the table) but I am trying to get it to work without the table
- Mark as New
- Bookmark
- Subscribe
- Mute
- Subscribe to RSS Feed
- Permalink
- Report Inappropriate Content
When I update the data, and refresh, it updates the table to the left but not the heatmap itself
- Mark as New
- Bookmark
- Subscribe
- Mute
- Subscribe to RSS Feed
- Permalink
- Report Inappropriate Content
I have managed to load your file after updating my version of powerbi. Strangely when I update the dataset using transform data, the visuals do not immediately update after hitting refresh. Can I confirm that all you do after updating the dataset is hit 'close and apply' within powerquery and then the 'refresh' button right next to the 'transform data' button
- Mark as New
- Bookmark
- Subscribe
- Mute
- Subscribe to RSS Feed
- Permalink
- Report Inappropriate Content
Perhaps there is something wrong with my version of powerbi. When I try to load the attached report I get the grey screen of death.
Helpful resources

Join our Fabric User Panel
This is your chance to engage directly with the engineering team behind Fabric and Power BI. Share your experiences and shape the future.

Power BI Monthly Update - June 2025
Check out the June 2025 Power BI update to learn about new features.

| User | Count |
|---|---|
| 68 | |
| 53 | |
| 53 | |
| 36 | |
| 34 |
| User | Count |
|---|---|
| 84 | |
| 71 | |
| 55 | |
| 45 | |
| 43 |


