cancel
Showing results for 
Search instead for 
Did you mean: 

A new Data Days event is coming soon! This time we’re going bigger than ever. Fabric, Power BI, SQL, AI and more. Don't miss out.

Reply
Anonymous
Not applicable

Visuals interactions - filtering using a specific fields only

Hello,


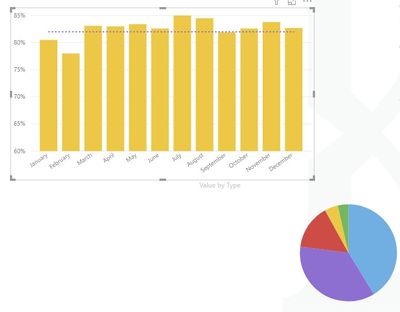
I would like to have interactions between Line Chart and Pie chart → when I click on Line chart bar, Pie Chart will show % share of elements.

The problem is, that the measure in line chart is a 'Value' column with filtered specific 'Type' column.

But the Pie Chart should show % share of items other than the one showing on the Line Chart for specific Month.


How to achieve that? I understand the default logic, that the filtered 'Type' item in Line chart is not present on Pie Chart, and the result is a blank chart if I click on specific month. But is there any way to make it work?


Visuals before I click on Month bar:

{84599083-E1E4-42A7-916B-9BB6E382AE3D}.png.jpg

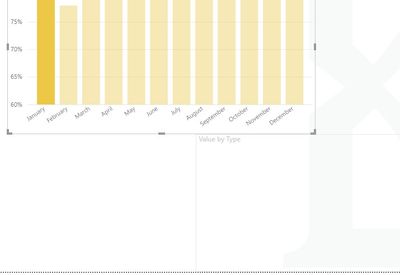
After I click specific month, Pie Chart disappears:

{C99B0537-F106-4A68-BF67-22984D14B181}.png.jpg

1 ACCEPTED SOLUTION
Anonymous
Not applicable

@AnonymousI've tried to replicate  visuals to send you a file, but it worked well. Checked again my report and after analysis it was an issue with data source 🙂 It's a pity I lost some time trying to configure visuals.


Please delete this topic if possible as it will not have any value for any users at this community 🙂

View solution in original post

4 REPLIES 4
Anonymous
Not applicable

HI @Anonymous,

AFAIK, you can't custom on visuals interaction filters.

In my opinion, I'd like to suggest you use measure formula to replace default value fields, you can add if statement to check if current content is blank and return specific calculation result.

Can you please share a sample pbix file for test? It should help to test and coding formula.

How to Get Your Question Answered Quickly 

Regards,

Xiaoxin Sheng

Anonymous
Not applicable

@AnonymousI've tried to replicate  visuals to send you a file, but it worked well. Checked again my report and after analysis it was an issue with data source 🙂 It's a pity I lost some time trying to configure visuals.


Please delete this topic if possible as it will not have any value for any users at this community 🙂

amitchandak
Super User
Super User

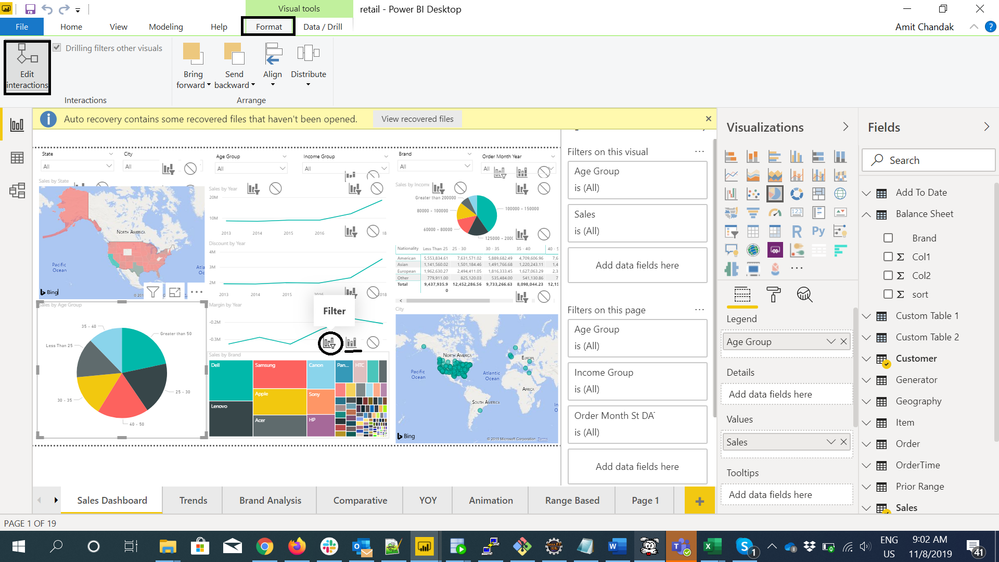
Check have you used fill interaction or filter interations

Interactions.png

Share with Power BI Enthusiasts: Full Power BI Video (20 Hours) YouTube
Microsoft Fabric Series 60+ Videos YouTube
Microsoft Fabric Hindi End to End YouTube
Anonymous
Not applicable

@amitchandakit does not matter in my case, any type of interaction gives me blank data on the Pie Chart after I click on month bar on Line Chart.

The problem is

- Line Chart includes only one Item from 'Type' column

- Pie Chart includes all items from 'Type' column except the one used in line chart


So after I click on the bar, I want to Pie Chart show me % share of the all other items, excluding the one which is on the Line Chart.

Helpful resources

Announcements
May Power BI Update Carousel

Power BI Monthly Update - May 2026

Check out the May 2026 Power BI update to learn about new features.

Fabric SQL PBI Data Days

Data Days 2026 coming soon!

Sign up to receive a private message when registration opens and key events begin.

New to Fabric survey Carousel

New to Fabric Survey

If you have recently started exploring Fabric, we'd love to hear how it's going. Your feedback can help with product improvements.

Power BI DataViz World Championships carousel

Power BI DataViz World Championships - June 2026

A new Power BI DataViz World Championship is coming this June! Don't miss out on submitting your entry.