
cancel
Showing results for 
Search instead for 
Did you mean: 

July 7 - July 17 | Round 2 of the Power BI Dataviz World Championships. Don't miss your chance! Learn more

Reply
GOEST
Frequent Visitor

Visualize filtered measure data

Hi!


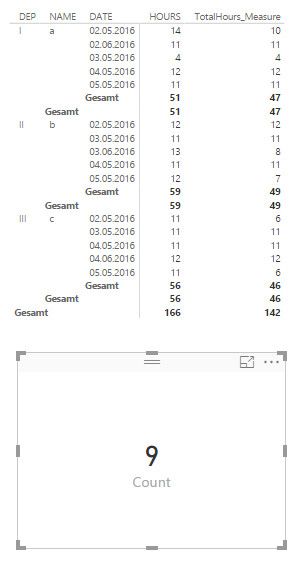
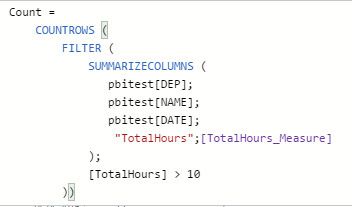
I am looking for a solution to the following problem: With the help from this forum I have generate two measures "count" and "TotalHours_Measure". Now I want to show the monthly "count" data in relation by the department. Has anybody an idea how I could do this?


Best regards

Stefan


count_tab.jpgcount.jpgTotalHours_Measure.jpg

1 ACCEPTED SOLUTION

Hi @GOEST,


You should be able to follow steps below to get your expected result.


1. Use the formula below to create a calculate table first.

SummaryTable = FILTER (
            SUMMARIZECOLUMNS (
               pbitest[DEP],
			   pbitest[NAME],
               pbitest[DATE],
                "TotalHours",[TotalHours_Measure]
            ),
            [TotalHours] > 10
        )


2. Create an individual Date table(using CALENDARAUTO or CALENDAR Function (DAX)), and create a relationship between the Date table and created "SummaryTable" using the date column.


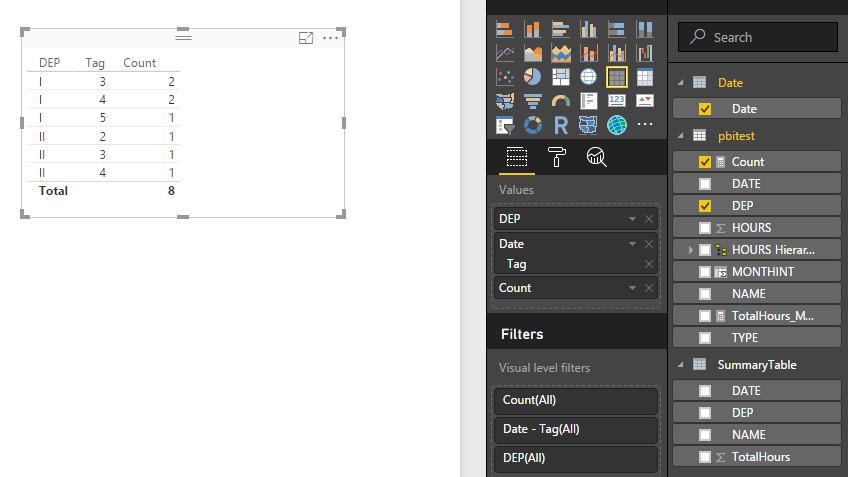
3. Then you should be able to use the formula below to show the monthly "count" data in relation by the department.

Count = 
IF (
    HASONEVALUE ( pbitest[DEP] ),
    CALCULATE (
        COUNTROWS ( 'SummaryTable' ),
        FILTER (
            'SummaryTable',
            'SummaryTable'[DEP] = VALUES ( pbitest[DEP] )
        )
    ),
    COUNTROWS ( 'SummaryTable' )
)

result2.PNG


Here is the modified sample pbix file for your reference.Smiley Happy


Regards

View solution in original post

4 REPLIES 4
v-ljerr-msft
Microsoft Employee
Microsoft Employee

Hi @GOEST,


Could you post your table structure and sample data with your expected result in this case? It's better to share a sample pbix file. You can upload it to OneDrive or Dropbox, and post the link here. Do mask sensitive data before uploading.Smiley Happy


Regards

Hi @v-ljerr-msft!


Thanks for your reply. You can find the files on:


https://www.dropbox.com/sh/cdeuki9k0x4lksy/AAClOIrREfCrcbeKUkRxIXkDa?dl=0

Best regards

Stefan

Hi @GOEST,


You should be able to follow steps below to get your expected result.


1. Use the formula below to create a calculate table first.

SummaryTable = FILTER (
            SUMMARIZECOLUMNS (
               pbitest[DEP],
			   pbitest[NAME],
               pbitest[DATE],
                "TotalHours",[TotalHours_Measure]
            ),
            [TotalHours] > 10
        )


2. Create an individual Date table(using CALENDARAUTO or CALENDAR Function (DAX)), and create a relationship between the Date table and created "SummaryTable" using the date column.


3. Then you should be able to use the formula below to show the monthly "count" data in relation by the department.

Count = 
IF (
    HASONEVALUE ( pbitest[DEP] ),
    CALCULATE (
        COUNTROWS ( 'SummaryTable' ),
        FILTER (
            'SummaryTable',
            'SummaryTable'[DEP] = VALUES ( pbitest[DEP] )
        )
    ),
    COUNTROWS ( 'SummaryTable' )
)

result2.PNG


Here is the modified sample pbix file for your reference.Smiley Happy


Regards

Hi @v-ljerr-msft!


Thanks for your answer. That looks realy good also with my real data! 🙂


BEst regards

Stefan

Helpful resources

Announcements
FabCon and SQLCon Barcelona 2026

FabCon & SQLCon – Barcelona 2026

Join us in Barcelona for FabCon and SQLCon, the Fabric, Power BI, SQL, and AI community event. Save €200 with code FABCMTY200.

60 days of Data Days Carousel

Data Days 2026

Join Data Days 2026: 60 days of free live/on-demand sessions, challenges, study groups, and certification opportunities.

Power BI DataViz World Championships carousel

Power BI DataViz World Championships - June 2026

A new Power BI DataViz World Championship is coming this June! Don't miss out on submitting your entry.

Top Solution Authors