Get certified for free when you join Fabric Data Days 2026 and dive into Fabric, Power BI, SQL, AI, and other essential data skills.
Join nowJuly 7 - July 17 | Round 2 of the Power BI Dataviz World Championships. Don't miss your chance! Learn more
Hey,
I am currently working on a data set of interval data with a corresponding date as shown below:
The are more parameter and values than shown and I need a visuel representation of the actual values (not average, max, sum etc.).
Are anyone aware of such an add-on to BI?, thanks
| VarName | TimeString | VarValue |
| Load extruder [%] - [Actual Value DB.load_extruder] | 03/05/2022 14:00 | 9913 |
| Melt temperature in front of melt filter - [Actual Value DB.melt_temp_in_front_of_mf] | 03/05/2022 14:00 | 2628 |
| Meltpressure in front of melt filter - [Actual Value DB.pressure_in_front_of_mf] | 03/05/2022 14:00 | 3184 |
| Load extruder [%] - [Actual Value DB.load_extruder] | 03/05/2022 14:00 | 9799 |
| Melt temperature in front of melt filter - [Actual Value DB.melt_temp_in_front_of_mf] | 03/05/2022 14:00 | 2623 |
| Meltpressure in front of melt filter - [Actual Value DB.pressure_in_front_of_mf] | 03/05/2022 14:00 | 3216 |
| Load extruder [%] - [Actual Value DB.load_extruder] | 03/05/2022 14:00 | 9340 |
| Melt temperature in front of melt filter - [Actual Value DB.melt_temp_in_front_of_mf] | 03/05/2022 14:00 | 2623 |
| Meltpressure in front of melt filter - [Actual Value DB.pressure_in_front_of_mf] | 03/05/2022 14:00 | 3120 |
| Load extruder [%] - [Actual Value DB.load_extruder] | 03/05/2022 14:00 | 9307 |
| Melt temperature in front of melt filter - [Actual Value DB.melt_temp_in_front_of_mf] | 03/05/2022 14:00 | 2623 |
| Meltpressure in front of melt filter - [Actual Value DB.pressure_in_front_of_mf] | 03/05/2022 14:00 | 3088 |
| Load extruder [%] - [Actual Value DB.load_extruder] | 03/05/2022 14:00 | 9536 |
Solved! Go to Solution.
Hi @gregers1972 ,
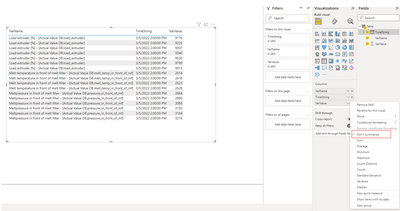
According to your statement, I think you want to show all data instead of summarizing the data like sum ,max or average in visual.
Here I suggest you to try Don't summarize function in value field in your visual.
Best Regards,
Rico Zhou
If this post helps, then please consider Accept it as the solution to help the other members find it more quickly.
The datatable was not so easy to read properly, now a better version
| VarName | TimeString | VarValue | |
| Load extruder [%] - [Actual Value DB.load_extruder] | 03/05/2022 14:00 | 9913 | |
| Melt temperature in front of melt filter - [Actual Value DB.melt_temp_in_front_of_mf] | 03/05/2022 14:00 | 2628 | |
| Meltpressure in front of melt filter - [Actual Value DB.pressure_in_front_of_mf] | 03/05/2022 14:00 | 3184 | |
| Load extruder [%] - [Actual Value DB.load_extruder] | 03/05/2022 14:00 | 9799 | |
| Melt temperature in front of melt filter - [Actual Value DB.melt_temp_in_front_of_mf] | 03/05/2022 14:00 | 2623 | |
| Meltpressure in front of melt filter - [Actual Value DB.pressure_in_front_of_mf] | 03/05/2022 14:00 | 3216 | |
| Load extruder [%] - [Actual Value DB.load_extruder] | 03/05/2022 14:00 | 9340 | |
| Melt temperature in front of melt filter - [Actual Value DB.melt_temp_in_front_of_mf] | 03/05/2022 14:00 | 2623 | |
| Meltpressure in front of melt filter - [Actual Value DB.pressure_in_front_of_mf] | 03/05/2022 14:00 | 3120 | |
| Load extruder [%] - [Actual Value DB.load_extruder] | 03/05/2022 14:00 | 9307 | |
| Melt temperature in front of melt filter - [Actual Value DB.melt_temp_in_front_of_mf] | 03/05/2022 14:00 | 2623 | |
| Meltpressure in front of melt filter - [Actual Value DB.pressure_in_front_of_mf] | 03/05/2022 14:00 | 3088 | |
| Load extruder [%] - [Actual Value DB.load_extruder] | 03/05/2022 14:00 | 9536 | |
| Melt temperature in front of melt filter - [Actual Value DB.melt_temp_in_front_of_mf] | 03/05/2022 14:00 | 2618 | |
| Meltpressure in front of melt filter - [Actual Value DB.pressure_in_front_of_mf] | 03/05/2022 14:00 | 2880 | |
| Load extruder [%] - [Actual Value DB.load_extruder] | 03/05/2022 14:00 | 9176 | |
| Melt temperature in front of melt filter - [Actual Value DB.melt_temp_in_front_of_mf] | 03/05/2022 14:00 | 2614 | |
| Meltpressure in front of melt filter - [Actual Value DB.pressure_in_front_of_mf] | 03/05/2022 14:00 | 2864 | |
| Load extruder [%] - [Actual Value DB.load_extruder] | 03/05/2022 14:00 | 9225 |
Hi @gregers1972 ,
According to your statement, I think you want to show all data instead of summarizing the data like sum ,max or average in visual.
Here I suggest you to try Don't summarize function in value field in your visual.
Best Regards,
Rico Zhou
If this post helps, then please consider Accept it as the solution to help the other members find it more quickly.
Thanks, I already did this however it only works in table format and not in line charts and cannot use the XY plot as I have date and time on the x-axis.
Anyhow, thanks for you valued input 🙂
Join us in Barcelona for FabCon and SQLCon, the Fabric, Power BI, SQL, and AI community event. Save €200 with code FABCMTY200.
Join Data Days 2026: 60 days of free live/on-demand sessions, challenges, study groups, and certification opportunities.
| User | Count |
|---|---|
| 26 | |
| 23 | |
| 19 | |
| 18 | |
| 15 |
| User | Count |
|---|---|
| 47 | |
| 44 | |
| 43 | |
| 35 | |
| 31 |