Fabric Data Days starts November 4th!
Advance your Data & AI career with 50 days of live learning, dataviz contests, hands-on challenges, study groups & certifications and more!
Get registered- Power BI forums
- Get Help with Power BI
- Desktop
- Service
- Report Server
- Power Query
- Mobile Apps
- Developer
- DAX Commands and Tips
- Custom Visuals Development Discussion
- Health and Life Sciences
- Power BI Spanish forums
- Translated Spanish Desktop
- Training and Consulting
- Instructor Led Training
- Dashboard in a Day for Women, by Women
- Galleries
- Data Stories Gallery
- Themes Gallery
- Contests Gallery
- QuickViz Gallery
- Quick Measures Gallery
- Visual Calculations Gallery
- Notebook Gallery
- Translytical Task Flow Gallery
- TMDL Gallery
- R Script Showcase
- Webinars and Video Gallery
- Ideas
- Custom Visuals Ideas (read-only)
- Issues
- Issues
- Events
- Upcoming Events
Get Fabric Certified for FREE during Fabric Data Days. Don't miss your chance! Request now
- Power BI forums
- Forums
- Get Help with Power BI
- Desktop
- Re: Using time data type as a value in bar chart
- Subscribe to RSS Feed
- Mark Topic as New
- Mark Topic as Read
- Float this Topic for Current User
- Bookmark
- Subscribe
- Printer Friendly Page
- Mark as New
- Bookmark
- Subscribe
- Mute
- Subscribe to RSS Feed
- Permalink
- Report Inappropriate Content
Using time data type as a value in bar chart
I have a column showing seconds (whole numbers) and would like to convert it to hh:mm and use it in a bar chart with date on the Y axis. Is it possible in Power BI? I have managed to create a column with hh:mm but when pulled into the value field it only displays the count.
Thank you
James
- Mark as New
- Bookmark
- Subscribe
- Mute
- Subscribe to RSS Feed
- Permalink
- Report Inappropriate Content
@whitej , New time column
time = time(time(Quotient([Col],3600) ,Quotient(Mod([Col],3600),60) ,mod(mod([Col],3600),60)) )
Add with date if needed
Date time = [Date] +[Time]
Use on axis
- Mark as New
- Bookmark
- Subscribe
- Mute
- Subscribe to RSS Feed
- Permalink
- Report Inappropriate Content
Also I need to be able to use the new column as a value and not on an axis
- Mark as New
- Bookmark
- Subscribe
- Mute
- Subscribe to RSS Feed
- Permalink
- Report Inappropriate Content
I am getting this error when creating the new column
- Mark as New
- Bookmark
- Subscribe
- Mute
- Subscribe to RSS Feed
- Permalink
- Report Inappropriate Content
@whitej See Chelsie Eiden's Duration, I created it for this exact scenario: Chelsie Eiden's Duration - Microsoft Power BI Community
Follow on LinkedIn
@ me in replies or I'll lose your thread!!!
Instead of a Kudo, please vote for this idea
Become an expert!: Enterprise DNA
External Tools: MSHGQM
YouTube Channel!: Microsoft Hates Greg
Latest book!: DAX For Humans
DAX is easy, CALCULATE makes DAX hard...
- Mark as New
- Bookmark
- Subscribe
- Mute
- Subscribe to RSS Feed
- Permalink
- Report Inappropriate Content
Do I need to create a new column or measure for this to work?
Thank you
- Mark as New
- Bookmark
- Subscribe
- Mute
- Subscribe to RSS Feed
- Permalink
- Report Inappropriate Content
Hi, @whitej
What's your original column and what do you want to change to? Can you share some sample data? So we can help you soon.
Did I answer your question ? Please mark my reply as solution. Thank you very much.
If not, please upload some insensitive data samples and expected output.
Best Regards,
Community Support Team _ Janey
- Mark as New
- Bookmark
- Subscribe
- Mute
- Subscribe to RSS Feed
- Permalink
- Report Inappropriate Content
So I have created a new measure called Duration Engineering Done to convert seconds to hh:mm:ss and it looks fine.
But I only want to see hh:mm. So if I change the Format at the top to 00:00 and remove the "seconds" in the dax then I am getting the following.
What I want to see is:
01-Jul-21 01:26
02-Jul-21 00:10
- Mark as New
- Bookmark
- Subscribe
- Mute
- Subscribe to RSS Feed
- Permalink
- Report Inappropriate Content
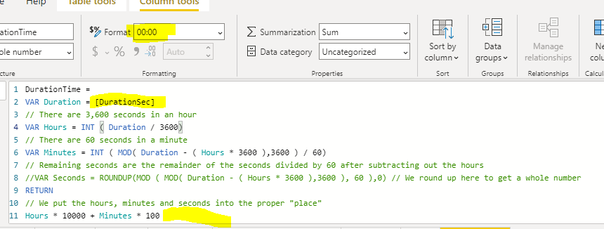
Great, thank you. Moving in the correct direction. I just had to remove the SUM from VAR Duration = SUM[Duration[
Also do not need the seconds so this is what I have done but having a slight problem when changing the fromat from 00:00:00 to 00:00. Looking at my DurationTime Column there is no : between my hour and my minute. Anything I can do to fix this?
- Mark as New
- Bookmark
- Subscribe
- Mute
- Subscribe to RSS Feed
- Permalink
- Report Inappropriate Content
Another way to do what you want is to keep your duration column as a decimal, create two measures (one for your total decimal, and one with that formatted as "hh:mm"), and use the Charticulator visual to make your chart. You would use the text measure in a text box label at the top of the bars.
(15) Austin Power BI User Group - Charticulator 101 - YouTube
Pat
Did I answer your question? Mark my post as a solution! Kudos are also appreciated!
To learn more about Power BI, follow me on Twitter or subscribe on YouTube.
@mahoneypa HoosierBI on YouTube
Helpful resources

Fabric Data Days
Advance your Data & AI career with 50 days of live learning, contests, hands-on challenges, study groups & certifications and more!

Power BI Monthly Update - October 2025
Check out the October 2025 Power BI update to learn about new features.


