Join us at FabCon Vienna from September 15-18, 2025
The ultimate Fabric, Power BI, SQL, and AI community-led learning event. Save €200 with code FABCOMM.
Get registered- Power BI forums
- Get Help with Power BI
- Desktop
- Service
- Report Server
- Power Query
- Mobile Apps
- Developer
- DAX Commands and Tips
- Custom Visuals Development Discussion
- Health and Life Sciences
- Power BI Spanish forums
- Translated Spanish Desktop
- Training and Consulting
- Instructor Led Training
- Dashboard in a Day for Women, by Women
- Galleries
- Data Stories Gallery
- Themes Gallery
- Contests Gallery
- Quick Measures Gallery
- Notebook Gallery
- Translytical Task Flow Gallery
- TMDL Gallery
- R Script Showcase
- Webinars and Video Gallery
- Ideas
- Custom Visuals Ideas (read-only)
- Issues
- Issues
- Events
- Upcoming Events
Compete to become Power BI Data Viz World Champion! First round ends August 18th. Get started.
- Power BI forums
- Forums
- Get Help with Power BI
- Desktop
- Re: Using .shp files in Power BI to create maps
- Subscribe to RSS Feed
- Mark Topic as New
- Mark Topic as Read
- Float this Topic for Current User
- Bookmark
- Subscribe
- Printer Friendly Page
- Mark as New
- Bookmark
- Subscribe
- Mute
- Subscribe to RSS Feed
- Permalink
- Report Inappropriate Content
Using .shp files in Power BI to create maps
Hi,
I have an SHP file that I am able to view using QGIS. I need to use this file to create a shape map in PowerBI.
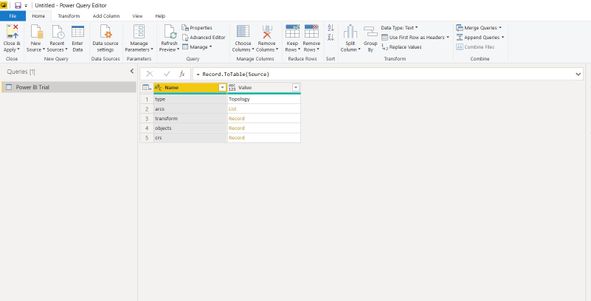
I have converted the file to .geojson and then to TopoJson as suggested by many threads. I am unable to move forward from this point.


I am stuck at this point and don't know how to expand this into a table contianing all my information and being able to plot the shape map.
I have tried this solution but it doesn't seem to work for me. Not sure if I am doing something wrong or if it is the wrong approach entirely for my case.
Any help is highly appreciated!
TIA
- Mark as New
- Bookmark
- Subscribe
- Mute
- Subscribe to RSS Feed
- Permalink
- Report Inappropriate Content
Hi @Anonymous ,
To create shape maps by using your custom topojson files, you can try the following steps without uploading it to Power Query Editors:
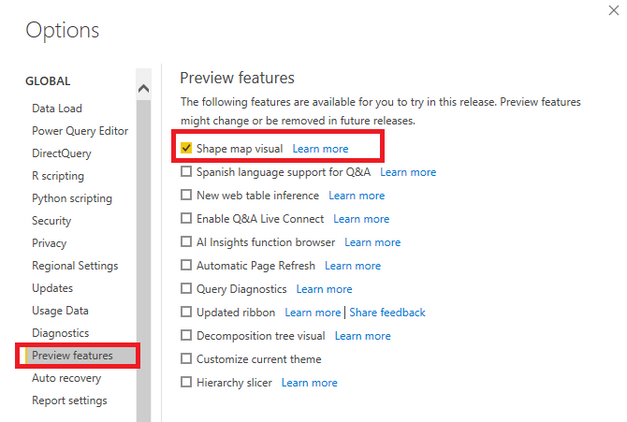
- Using the latest version power bi desktop,( https://www.microsoft.com/en-us/download/details.aspx?id=45331) ,enable Shape map features (Files > Options and settings > Options > Preview features > Shape map visual).
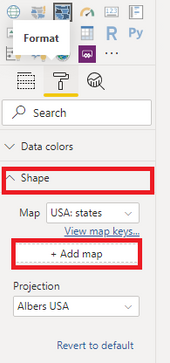
- When you create a shape map, in Format menu, under Shape options, select ‘+Add map’ and choose your custom .json file.
For further information about shape map, you can refer the following Microsoft document that can also help you:
https://docs.microsoft.com/en-us/power-bi/visuals/desktop-shape-map
Best Regards,
Yingjie Li
If this post helps then please consider Accept it as the solution to help the other members find it more quickly.
- Mark as New
- Bookmark
- Subscribe
- Mute
- Subscribe to RSS Feed
- Permalink
- Report Inappropriate Content
Thank you for this explanation.
I'm very new to PowerBI, and tried to upload a shapefile just as a test run.
As I understand, a data sheet must be loaded in order to visualize any type of map.
I loaded a "dummy" excel file with 1 row, but when opening a new shape map, I don't have the option to "add a map type".
Any tips on it? I'm really struggeling to load any shapefile to a project.
- Mark as New
- Bookmark
- Subscribe
- Mute
- Subscribe to RSS Feed
- Permalink
- Report Inappropriate Content
HI, Sorry to bring this up again, but I have a similiar situation. I have done the above steps using the custom maps, however the Map contains Alaska and Hawaii. In R, it looks like a filter can be applied to the shape map. Is that possible in Power BI?
- Mark as New
- Bookmark
- Subscribe
- Mute
- Subscribe to RSS Feed
- Permalink
- Report Inappropriate Content
Hi @Anonymous ,
maybe this helps.
https://docs.microsoft.com/en-us/power-bi/visuals/desktop-shape-map
Please mark my post as solution, this will also help others.
Please give Kudos for support.
Marcus Wegener works as Full Stack Power BI Engineer at BI or DIE.
His mission is clear: "Get the most out of data, with Power BI."
twitter - LinkedIn - YouTube - website - podcast - Power BI Tutorials


