Fabric Data Days starts November 4th!
Advance your Data & AI career with 50 days of live learning, dataviz contests, hands-on challenges, study groups & certifications and more!
Get registered- Power BI forums
- Get Help with Power BI
- Desktop
- Service
- Report Server
- Power Query
- Mobile Apps
- Developer
- DAX Commands and Tips
- Custom Visuals Development Discussion
- Health and Life Sciences
- Power BI Spanish forums
- Translated Spanish Desktop
- Training and Consulting
- Instructor Led Training
- Dashboard in a Day for Women, by Women
- Galleries
- Data Stories Gallery
- Themes Gallery
- Contests Gallery
- Quick Measures Gallery
- Visual Calculations Gallery
- Notebook Gallery
- Translytical Task Flow Gallery
- TMDL Gallery
- R Script Showcase
- Webinars and Video Gallery
- Ideas
- Custom Visuals Ideas (read-only)
- Issues
- Issues
- Events
- Upcoming Events
Join us at FabCon Atlanta from March 16 - 20, 2026, for the ultimate Fabric, Power BI, AI and SQL community-led event. Save $200 with code FABCOMM. Register now.
- Power BI forums
- Forums
- Get Help with Power BI
- Desktop
- Re: Using a table visual, splitting the results in...
- Subscribe to RSS Feed
- Mark Topic as New
- Mark Topic as Read
- Float this Topic for Current User
- Bookmark
- Subscribe
- Printer Friendly Page
- Mark as New
- Bookmark
- Subscribe
- Mute
- Subscribe to RSS Feed
- Permalink
- Report Inappropriate Content
Using a table visual, splitting the results into 2 columns
Hello,
I have a table with a single column, but I want the results to be split among two columns instead.


I understand I might need to use a DAX query for this, but how can it be done?
Thank you!
- Mark as New
- Bookmark
- Subscribe
- Mute
- Subscribe to RSS Feed
- Permalink
- Report Inappropriate Content
Hi @Anonymous ,
what is the logic for splitting into 2 columns?
You simply want the bottom half of rows to be in the 2nd column? or something different
LC
Interested in Power BI and DAX templates? Check out my blog at www.finance-bi.com
- Mark as New
- Bookmark
- Subscribe
- Mute
- Subscribe to RSS Feed
- Permalink
- Report Inappropriate Content
That is correct. Either taking the bottom half results and printing them to a second column, or just alternating printing between to columns.
- Mark as New
- Bookmark
- Subscribe
- Mute
- Subscribe to RSS Feed
- Permalink
- Report Inappropriate Content
Hi @Anonymous ,
You can download my proposed solution from here.
Here are the steps:
1) add an Index column in Power Query
2) Go back to Power BI and add a calculated column. Here is DAX the formula for it:
Column number =
VAR numberOfRows = COUNTROWS('Text')
RETURN IF ([Index]<=numberOfRows/2 , 1,2)
This calculated column returns 1 for the first half of the rows (to be included in column 1) and 2 for the second half of the rows (to be included in column 2).
3) Add 2 tables to your report. Filter the first table for column number =1 and the second table for column number=2.
That's it!
Does this help you?
LC
Interested in Power BI and DAX tutorials? Check out my blog at www.finance-bi.com
- Mark as New
- Bookmark
- Subscribe
- Mute
- Subscribe to RSS Feed
- Permalink
- Report Inappropriate Content
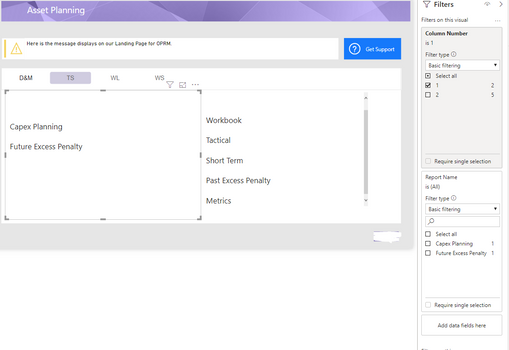
@lc_financeI followed the steps now, and the list of report names changed, but the reports are still split unevenly. The split needs to happen after the slicer labeled D&M, TS, WS, and WL are applied.

- Mark as New
- Bookmark
- Subscribe
- Mute
- Subscribe to RSS Feed
- Permalink
- Report Inappropriate Content
Hi @Anonymous ,
in that case, you can create a calculated measure instead of a calculated column.
Calculated measure take into account any filter that you apply to your Power BI.
You can use a slightly different DAX formula for the calculated measure:
Column number =
VAR numberOfRows = COUNTROWS('Text')
VAR currentIndex = SELECTEDVALUE('Text'[Index])
RETURN IF (currentIndex<=numberOfRows/2 , 1,2)
Does this help you?
LC
Interested in Power BI and DAX templates? Check out my blog at www.finance-bi.com
- Mark as New
- Bookmark
- Subscribe
- Mute
- Subscribe to RSS Feed
- Permalink
- Report Inappropriate Content
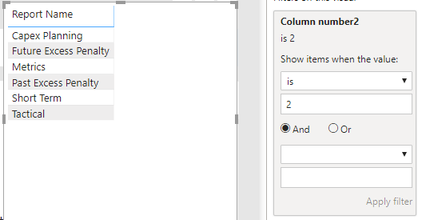
@lc_finance I added the quick measure, but the report names I have are all valued at 2 now. When changing the filter to 'is 1' nothing appears, but 'is 2' produces all the reports.
Below is how I adapted your example to my data, if that helps.
Column number2 =
VAR numberOfRows = COUNTROWS('master')
VAR currentIndex = SELECTEDVALUE('master'[Index.1])
RETURN IF (currentIndex<=numberOfRows/2 , 1,2)
- Mark as New
- Bookmark
- Subscribe
- Mute
- Subscribe to RSS Feed
- Permalink
- Report Inappropriate Content
Hi @Anonymous ,
could you share an example of your Power BI file?
That would help me to better understand the issue. You can upload it to a service like One Drive, Google Drive, Dropbox and then share the link.
Regards,
LC
- Mark as New
- Bookmark
- Subscribe
- Mute
- Subscribe to RSS Feed
- Permalink
- Report Inappropriate Content
@lc_finance I am not able to due to the sensativity of the data. However, I think what I need is a calculated measure.
To recap, I have two slicers that filtered down a list of report names into a matrix. A second matrix is being added, and the filtered report names need to be split so that one half is in matrix one, and one half in matrix two. I don't think the correct solution is to split the underlying data but instead to have the result of the two slicers split. Would you agree?
- Mark as New
- Bookmark
- Subscribe
- Mute
- Subscribe to RSS Feed
- Permalink
- Report Inappropriate Content
Hi @Anonymous ,
Yes, I agree, we should split the result of the slicers into 2.
Calculated measures are the right way to do it because they take into account the result of all the slicers.
I understand about the confidential data. In that case, could you share a sample Power BI file where you put sample/fake data?
A Power BI example would be very helpful in understanding why the measures I proposed to you do not seem to work
LC
Interested in Power BI and DAX tutorials? Check out my blog at www.finance-bi.com


