Forum Discussion

Using a Pie Chart as Slicer
Hey guys:
Trying to use a pie chart as a slicer and something just isn't clicking for me, hoping you could help
If I have a table
| Store | Apples | Bananas | Oranges |
| Kroger | 1 | 0 | 0 |
| Kroger | 1 | 0 | 1 |
| Kroger | 1 | 0 | 1 |
| Walmart | 1 | 1 | 0 |
| Walmart | 1 | 1 | 1 |
| Walmart | 1 | 1 | 0 |
| Publix | 1 | 0 | 1 |
| Publix | 0 | 1 | 0 |
Where if the store carries the product there is a 1 in the cell
I have one visualization that is bar chart of count of store so Kroger-3, WalMart - 3, and Publix - 2 and a pie chart that is the sum of Apples at 47%, Bananas at 27% and Oranges at 27%.
If I click on the store name the pie chart will adjust, but if click on a slice of the pie I would like only the stores that carry that item (1 in the column) to be sliced through in the bar chart.
What am I missing on this? Sorry if it is super elementary.
Chris
3 Replies
- AnonymousNot applicable
It is really a question of how your data is modelled. There is no link between stores (rows) and product (columns) so we need to bring it together a bit better.
If you go to Query Editor, select the three columns (Apples, Bananas and Oranges), right click and select Unpivot Columns. you should get a result like the below:
Kroger Apples 1 Kroger Bananas 0 Kroger Oranges 0 Kroger Apples 1 Kroger Bananas 0 Kroger Oranges 1 Kroger Apples 1 Kroger Bananas 0 Kroger Oranges 1 Walmart Apples 1 Walmart Bananas 1 Walmart Oranges 0 Walmart Apples 1 Walmart Bananas 1 Walmart Oranges 1 Walmart Apples 1 Walmart Bananas 1 Walmart Oranges 0 Publix Apples 1 Publix Bananas 0 Publix Oranges 1 Publix Apples 0 Publix Bananas 1 Publix Oranges 0 You can then Close and Apply then use the Attribute column (Apples, Bananas, Oranges) as your Details and the Value column (1,0) as your Values in your pie chart.
- AnonymousNot applicable
Makes sense! So my topic has many things you can imagine, friuts, veggies, breads, etc. So what I was thinking was rather than unpivot one sheet multiple times have a record number and split the sheets up into a fruit sheet, veggie sheet, bread sheet, etc. So rather than.
Store Apples Bananas Oranges Lettuce Cabbage Peppers White Bread Wheat Bread Breadsticks Kroger 1 0 0 1 0 1 1 0 0 Kroger 1 0 1 0 0 1 1 1 1 Kroger 1 0 1 1 0 0 0 1 0 Walmart 1 1 0 0 1 0 0 0 1 Walmart 1 1 1 1 1 1 0 1 0 Walmart 1 1 0 0 0 1 1 1 1 Publix 1 0 1 1 0 0 1 0 0 Publix 0 1 0 0 0 0 1 0 1 Where you would unpivot 3 times (really making the processor work, my data set make the linking take an hour) I did
ID Store 1 Kroger 2 Kroger 3 Kroger 4 Walmart 5 Walmart 6 Walmart 7 Publix 8 Publix ID Apples Bananas Oranges 1 1 0 0 2 1 0 1 3 1 0 1 4 1 1 0 5 1 1 1 6 1 1 0 7 1 0 1 8 0 1 0 ID Lettuce Cabbage Peppers 1 1 0 1 2 0 0 1 3 1 0 0 4 0 1 0 5 1 1 1 6 0 0 1 7 1 0 0 8 0 0 0 ID White Bread Wheat Bread Breadsticks 1 1 0 0 2 1 1 1 3 0 1 0 4 0 0 1 5 0 1 0 6 1 1 1 7 1 0 0 8 1 0 1 So I only unpivot once, but on three different tables.
However when linking based on ID number the graphs do not interact. Do they have to be in one sheet to interact or am I missing something?
Thanks,
Chris
 v-lili6-msftCommunity Support
hi, Anonymous
For these tables you need to create a relationship based on ID number like this, keep Cross filter direct is Both
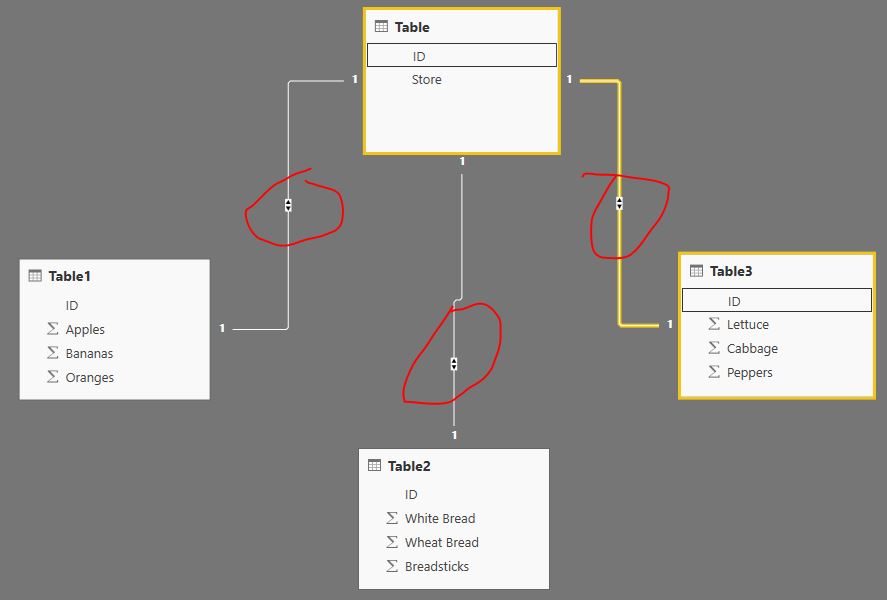
Then the graphs will do interact.
Best Regards,
Lin