This time we’re going bigger than ever. Fabric, Power BI, SQL, AI and more. We're covering it all. You won't want to miss it.
Learn moreLevel up your Power BI skills this month - build one visual each week and tell better stories with data! Get started
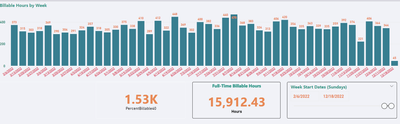
I have a Card that shows me the sum of values from the visible bar graph ("Full-Time Billable Hours").
How do I get the average of their values instead? (aka Divide the bars' cumulative sum by how many of them are visible?)
(If only 1 bar is clicked on/highlighted, I want it to continue to only show that bar's value, aka divide by 1.)
Solved! Go to Solution.
AverageBillable = AVERAGEX(ALLSELECTED('hbdg time_entry'[Week Start Date]),'hbdg time_entry'[Hours])
Check out the April 2026 Power BI update to learn about new features.
Sign up to receive a private message when registration opens and key events begin.
If you have recently started exploring Fabric, we'd love to hear how it's going. Your feedback can help with product improvements.
| User | Count |
|---|---|
| 30 | |
| 24 | |
| 23 | |
| 17 | |
| 15 |
| User | Count |
|---|---|
| 61 | |
| 36 | |
| 29 | |
| 22 | |
| 21 |