FabCon is coming to Atlanta
Join us at FabCon Atlanta from March 16 - 20, 2026, for the ultimate Fabric, Power BI, AI and SQL community-led event. Save $200 with code FABCOMM.
Register now!- Power BI forums
- Get Help with Power BI
- Desktop
- Service
- Report Server
- Power Query
- Mobile Apps
- Developer
- DAX Commands and Tips
- Custom Visuals Development Discussion
- Health and Life Sciences
- Power BI Spanish forums
- Translated Spanish Desktop
- Training and Consulting
- Instructor Led Training
- Dashboard in a Day for Women, by Women
- Galleries
- Data Stories Gallery
- Themes Gallery
- Contests Gallery
- QuickViz Gallery
- Quick Measures Gallery
- Visual Calculations Gallery
- Notebook Gallery
- Translytical Task Flow Gallery
- TMDL Gallery
- R Script Showcase
- Webinars and Video Gallery
- Ideas
- Custom Visuals Ideas (read-only)
- Issues
- Issues
- Events
- Upcoming Events
The Power BI Data Visualization World Championships is back! It's time to submit your entry. Live now!
- Power BI forums
- Forums
- Get Help with Power BI
- Desktop
- Re: Unstack Column
- Subscribe to RSS Feed
- Mark Topic as New
- Mark Topic as Read
- Float this Topic for Current User
- Bookmark
- Subscribe
- Printer Friendly Page
- Mark as New
- Bookmark
- Subscribe
- Mute
- Subscribe to RSS Feed
- Permalink
- Report Inappropriate Content
Unstack Column
Hi all,
I'm new to this forum. I have just commeced a new career as a Business Analyst and I am learning how to use Power BI. I have limited previous experience with Power Queries.
I have an issue where I want to unstack data from a column and put the data into a table. I have looked at numerous youtube videos on power queries to unstack data using an index colum. My issue is that the number of data points in my stacked data is uneven, so the index option does not work for me. i.e my first block of data in Column A contains 20 data points, my second block of data contains 15 data points. Each block of data is seperated by a blank row if this is beneficial.
Is there a solution for unstacking the data in Column A to create a table using Power Query?
Any help is much appreciated.
Thanks in advance.
Solved! Go to Solution.
- Mark as New
- Bookmark
- Subscribe
- Mute
- Subscribe to RSS Feed
- Permalink
- Report Inappropriate Content
Hi @rayhannon ,
Maybe you can try the following steps and the related codes in advanced editor in power query editor and I'll help you to understand:
let
    Source = Table.FromRows(Json.Document(Binary.Decompress(Binary.FromText("pVLLbsIwEPyVVc4E/IgT4GaCG1zyoIlpC4hD2iJRCbVS2h74+yZOnCgCpEo9emd21jO7u51FKXKsgWXtBztLHX+Kr7f8DAyivHg9AkEEGRDTqUOmxDPvZV4cPr6Xh9PpbEp+EiZpxJW/kHGATfX+8wUIowhkAAsOcxu1GpmIJERcKsCuTYgpXxJV8Z6frghgTOAuhJivuFokIaRiXkJoiKiLNIFovCxD8iznAjajTBMwYw3BqwgPaxnHbTdGqAap7l6J0lQsYgVJyuNA1BMMx0GdQMSDksabKWTIWpIWkmnAt7Kb02mMK3gjwjB5gtAm2EE1wTWEibGRKttjk7qfmH6m/zAbZe0P+vo6XWjSVqoE3c7kbQO4UzCBU8/5+7mwKR3//1xIq+H7sjfjkqHvhF5pLd1WLoNUiLgKqp8fpRXo83Qmt+UVPcokFKofwO2UnKHT7kHrrLNmlc0p4ltLKOWdqnP/Cw==", BinaryEncoding.Base64), Compression.Deflate)), let _t = ((type text) meta [Serialized.Text = true]) in type table [Column1 = _t, Column2 = _t]),
    #"Changed Type" = Table.TransformColumnTypes(Source,{{"Column1", type text}, {"Column2", type number}}),
    #"Replaced Value" = Table.ReplaceValue(#"Changed Type","",null,Replacer.ReplaceValue,{"Column1"}),
    #"Added Index" = Table.AddIndexColumn(#"Replaced Value", "Index", 1, 1),
    #"Added Custom" = Table.AddColumn(#"Added Index", "Custom", each let i = [Index]
in
Table.RowCount(Table.SelectRows(#"Added Index",each [Index]<i and [Column1]=null and [Column2]=null))),
    #"Grouped Rows" = Table.Group(#"Added Custom", {"Custom"}, {{"Data", each _, type table [Column1=text, Column2=number, Index=number, Custom=number]}}),
    #"Added Custom1" = Table.AddColumn(#"Grouped Rows", "ShapedData", each let  #"Sorted Rows" = Table.Sort([Data],{{"Index", Order.Ascending}}),
    #"Added Index1" = Table.AddIndexColumn(#"Sorted Rows", "Index.1", 1, 1),
    #"Removed Columns" = Table.RemoveColumns(#"Added Index1",{"Index", "Custom"})
  in
  Table.SelectRows(#"Removed Columns",each [Column1] <> null or [Column2] <> null)),
    #"Added Custom2" = Table.AddColumn(#"Added Custom1", "Custom.1", each let job = [ShapedData]{0}[Column1],
dt = [ShapedData]{1}[Column1] & " "&[ShapedData]{2}[Column1]
in
Table.Skip(Table.AddColumn(Table.AddColumn([ShapedData],"Job Number",each job),"Date Time",each dt),3)),
    #"Removed Columns" = Table.RemoveColumns(#"Added Custom2",{"Data", "ShapedData", "Custom"}),
    #"Expanded Custom.1" = Table.ExpandTableColumn(#"Removed Columns", "Custom.1", {"Column1", "Column2", "Index.1", "Job Number", "Date Time"}, {"Custom.1.Column1", "Custom.1.Column2", "Custom.1.Index.1", "Custom.1.Job Number", "Custom.1.Date Time"}),
    #"Changed Type1" = Table.TransformColumnTypes(#"Expanded Custom.1",{{"Custom.1.Date Time", type datetime}, {"Custom.1.Job Number", Int64.Type}, {"Custom.1.Index.1", Int64.Type}, {"Custom.1.Column2", type number}, {"Custom.1.Column1", type text}})
in
#"Changed Type1"- Replace values from " " to "null":
- Add an index column to mark each row:
- Add a custom column to distinguish different data blocks:
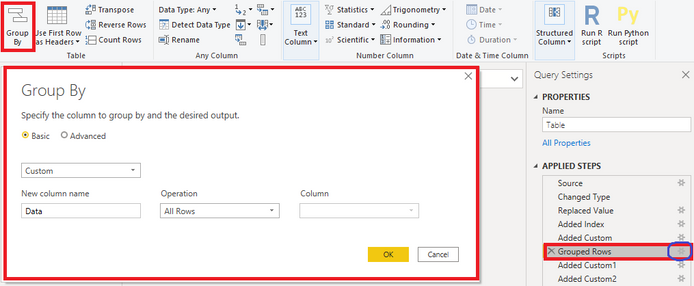
- Group by the previous custom column:
- Add custom columns to extract columns and skip some columns:
- Reomove unnecrssary columns and expand table:
- The final table is like this:
- To count colors by date / job number, just create a table visual and apply corresponding filters in the table visual:
All steps can be seen in the Applied steps in the right of power query editor and you can use the gear icon to test and check:
Finally, the sample file attached hopes to help you, please try it: PBIX
Best Regards,
Yingjie Li
If this post helps then please consider Accept it as the solution to help the other members find it more quickly.
- Mark as New
- Bookmark
- Subscribe
- Mute
- Subscribe to RSS Feed
- Permalink
- Report Inappropriate Content
Hi @rayhannon ,
It's my pleasure🙂.
1. I didn't enter these total columns previously becasuse I thought they are used as a reference. If you want to import from excel, you can remove these columns directly and still maintain a blank row between two data blocks.
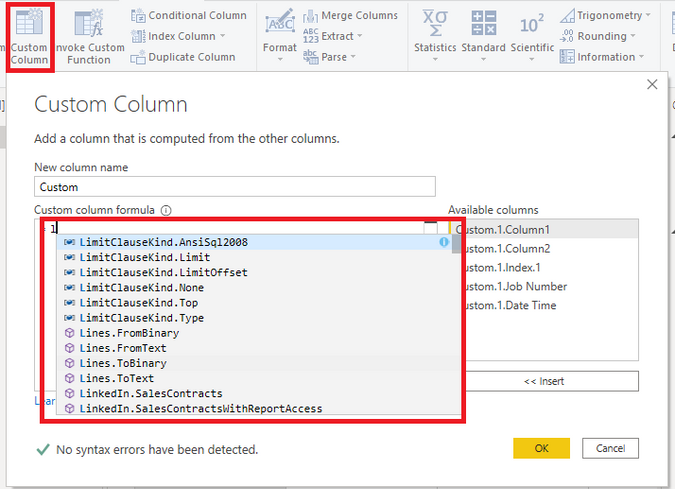
2. When creating custom columns, you need to use some formulas that power bi will prompt you if you enter the first few letters of the formula in Custom column page.
3. It is not essential to be able to write Power Queries in M except create some custom columns. As I previously posted, you can click the gear icon to see the detail actions in Applied steps and you can find the corresponding actions in the menu bar on the top of power query editor.
For example, using group by function just need to find the Group By icon in the menu. I put all codes in this post is just convenient to introduce each summary step.
If you are interested in M query function, you can refer these two microsoft documets as a simple understanding:
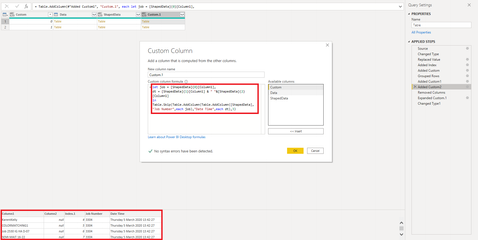
4. Add Custom Column1 is to shapedata to remove the 'custom column':
Add Custom Column2 is to skip these rows which I thought is used as something about Job number and set them as new columns to skip these previous rows (not columns, sorry for previously post)
For this issue, I extract top3 rows and set them as two 2 new columns( It depends on your own decision) and remove these selected 3 rows
Best Regards,
Yingjie Li
If this post helps then please consider Accept it as the solution to help the other members find it more quickly.
- Mark as New
- Bookmark
- Subscribe
- Mute
- Subscribe to RSS Feed
- Permalink
- Report Inappropriate Content
Can you share sample data and sample output.
- Mark as New
- Bookmark
- Subscribe
- Mute
- Subscribe to RSS Feed
- Permalink
- Report Inappropriate Content
Hi,
Sorry for the delay. I'm now unsure if unstacking the column is the best solution. I'll go back to the start to give you a brief description of my problem and I am open to any possible solutions.
Attached is an example of the source data exported to excel from a Spectrophotometer (used for mixing paint colours). As can be seen all the data is stacked into two columns. I have included a brief description of the data included in each row of the first colour run.
The Spectrophotometer produces a new block of data for each colour run, which is seperated from the previous colour run by a blank row. I have incuded two colour runs in the attached sheet. The problem is that there can be 100's of colour runs a day all with different amount of colours mixed.
I was hoping to use power Bi for the below reporting requirements;
- The quantity of mixing colours used on a daily/monthly basis
- The quantity of mixing colours used per Job No/Parent Job Number
What is the best was to sort my data before using visulaisation techniques on Power BI. I have sorted the data manually and it works fine but this is not a solution for large excel files with hundreds of colour runs.
Any pointers or help would be very much appreciated.
Thanks in advance @amitchandak
- Mark as New
- Bookmark
- Subscribe
- Mute
- Subscribe to RSS Feed
- Permalink
- Report Inappropriate Content
Hi @rayhannon ,
Maybe you can try the following steps and the related codes in advanced editor in power query editor and I'll help you to understand:
let
    Source = Table.FromRows(Json.Document(Binary.Decompress(Binary.FromText("pVLLbsIwEPyVVc4E/IgT4GaCG1zyoIlpC4hD2iJRCbVS2h74+yZOnCgCpEo9emd21jO7u51FKXKsgWXtBztLHX+Kr7f8DAyivHg9AkEEGRDTqUOmxDPvZV4cPr6Xh9PpbEp+EiZpxJW/kHGATfX+8wUIowhkAAsOcxu1GpmIJERcKsCuTYgpXxJV8Z6frghgTOAuhJivuFokIaRiXkJoiKiLNIFovCxD8iznAjajTBMwYw3BqwgPaxnHbTdGqAap7l6J0lQsYgVJyuNA1BMMx0GdQMSDksabKWTIWpIWkmnAt7Kb02mMK3gjwjB5gtAm2EE1wTWEibGRKttjk7qfmH6m/zAbZe0P+vo6XWjSVqoE3c7kbQO4UzCBU8/5+7mwKR3//1xIq+H7sjfjkqHvhF5pLd1WLoNUiLgKqp8fpRXo83Qmt+UVPcokFKofwO2UnKHT7kHrrLNmlc0p4ltLKOWdqnP/Cw==", BinaryEncoding.Base64), Compression.Deflate)), let _t = ((type text) meta [Serialized.Text = true]) in type table [Column1 = _t, Column2 = _t]),
    #"Changed Type" = Table.TransformColumnTypes(Source,{{"Column1", type text}, {"Column2", type number}}),
    #"Replaced Value" = Table.ReplaceValue(#"Changed Type","",null,Replacer.ReplaceValue,{"Column1"}),
    #"Added Index" = Table.AddIndexColumn(#"Replaced Value", "Index", 1, 1),
    #"Added Custom" = Table.AddColumn(#"Added Index", "Custom", each let i = [Index]
in
Table.RowCount(Table.SelectRows(#"Added Index",each [Index]<i and [Column1]=null and [Column2]=null))),
    #"Grouped Rows" = Table.Group(#"Added Custom", {"Custom"}, {{"Data", each _, type table [Column1=text, Column2=number, Index=number, Custom=number]}}),
    #"Added Custom1" = Table.AddColumn(#"Grouped Rows", "ShapedData", each let  #"Sorted Rows" = Table.Sort([Data],{{"Index", Order.Ascending}}),
    #"Added Index1" = Table.AddIndexColumn(#"Sorted Rows", "Index.1", 1, 1),
    #"Removed Columns" = Table.RemoveColumns(#"Added Index1",{"Index", "Custom"})
  in
  Table.SelectRows(#"Removed Columns",each [Column1] <> null or [Column2] <> null)),
    #"Added Custom2" = Table.AddColumn(#"Added Custom1", "Custom.1", each let job = [ShapedData]{0}[Column1],
dt = [ShapedData]{1}[Column1] & " "&[ShapedData]{2}[Column1]
in
Table.Skip(Table.AddColumn(Table.AddColumn([ShapedData],"Job Number",each job),"Date Time",each dt),3)),
    #"Removed Columns" = Table.RemoveColumns(#"Added Custom2",{"Data", "ShapedData", "Custom"}),
    #"Expanded Custom.1" = Table.ExpandTableColumn(#"Removed Columns", "Custom.1", {"Column1", "Column2", "Index.1", "Job Number", "Date Time"}, {"Custom.1.Column1", "Custom.1.Column2", "Custom.1.Index.1", "Custom.1.Job Number", "Custom.1.Date Time"}),
    #"Changed Type1" = Table.TransformColumnTypes(#"Expanded Custom.1",{{"Custom.1.Date Time", type datetime}, {"Custom.1.Job Number", Int64.Type}, {"Custom.1.Index.1", Int64.Type}, {"Custom.1.Column2", type number}, {"Custom.1.Column1", type text}})
in
#"Changed Type1"- Replace values from " " to "null":
- Add an index column to mark each row:
- Add a custom column to distinguish different data blocks:
- Group by the previous custom column:
- Add custom columns to extract columns and skip some columns:
- Reomove unnecrssary columns and expand table:
- The final table is like this:
- To count colors by date / job number, just create a table visual and apply corresponding filters in the table visual:
All steps can be seen in the Applied steps in the right of power query editor and you can use the gear icon to test and check:
Finally, the sample file attached hopes to help you, please try it: PBIX
Best Regards,
Yingjie Li
If this post helps then please consider Accept it as the solution to help the other members find it more quickly.
- Mark as New
- Bookmark
- Subscribe
- Mute
- Subscribe to RSS Feed
- Permalink
- Report Inappropriate Content
Hi @v-yingjl ,
Thank you very much for taking the time to respond in such detail. It was really helpfull. Can I ask you a few follow questions?
- I note that you entered the data I sent you in picture format in a table without including the total columns. If I was to bring the data directly from Excel, what is the best way to remove the unwanted rows at the start? There may be 100's of total cells in the column. Would I covert the rows containing total values to blank rows and then delete blank rows?
- I note that you entered some custom columns. Did you enter the custom column formula directly or is there a tool to assist you to write M code?
- Is it essential to be able to write Power Queries in M if working with Power BI? If so can you direct me to some good courses for beginners.
- Can you give me a brief summary of Step 5 - Add custom columns to extract columns and skip some columns:
Thanks again for your help. It's very much appreciated.
Kind regards.
Ray
- Mark as New
- Bookmark
- Subscribe
- Mute
- Subscribe to RSS Feed
- Permalink
- Report Inappropriate Content
Hi @rayhannon ,
It's my pleasure🙂.
1. I didn't enter these total columns previously becasuse I thought they are used as a reference. If you want to import from excel, you can remove these columns directly and still maintain a blank row between two data blocks.
2. When creating custom columns, you need to use some formulas that power bi will prompt you if you enter the first few letters of the formula in Custom column page.
3. It is not essential to be able to write Power Queries in M except create some custom columns. As I previously posted, you can click the gear icon to see the detail actions in Applied steps and you can find the corresponding actions in the menu bar on the top of power query editor.
For example, using group by function just need to find the Group By icon in the menu. I put all codes in this post is just convenient to introduce each summary step.
If you are interested in M query function, you can refer these two microsoft documets as a simple understanding:
4. Add Custom Column1 is to shapedata to remove the 'custom column':
Add Custom Column2 is to skip these rows which I thought is used as something about Job number and set them as new columns to skip these previous rows (not columns, sorry for previously post)
For this issue, I extract top3 rows and set them as two 2 new columns( It depends on your own decision) and remove these selected 3 rows
Best Regards,
Yingjie Li
If this post helps then please consider Accept it as the solution to help the other members find it more quickly.
Helpful resources
| User | Count |
|---|---|
| 50 | |
| 40 | |
| 31 | |
| 24 | |
| 22 |
| User | Count |
|---|---|
| 134 | |
| 112 | |
| 57 | |
| 44 | |
| 38 |


