Join the #PBI10 DataViz contest
Power BI is turning 10, and we’re marking the occasion with a special community challenge. Use your creativity to tell a story, uncover trends, or highlight something unexpected.
Get started- Power BI forums
- Get Help with Power BI
- Desktop
- Service
- Report Server
- Power Query
- Mobile Apps
- Developer
- DAX Commands and Tips
- Custom Visuals Development Discussion
- Health and Life Sciences
- Power BI Spanish forums
- Translated Spanish Desktop
- Training and Consulting
- Instructor Led Training
- Dashboard in a Day for Women, by Women
- Galleries
- Webinars and Video Gallery
- Data Stories Gallery
- Themes Gallery
- Contests Gallery
- Quick Measures Gallery
- Notebook Gallery
- Translytical Task Flow Gallery
- R Script Showcase
- Ideas
- Custom Visuals Ideas (read-only)
- Issues
- Issues
- Events
- Upcoming Events
Join us for an expert-led overview of the tools and concepts you'll need to become a Certified Power BI Data Analyst and pass exam PL-300. Register now.
- Power BI forums
- Forums
- Get Help with Power BI
- Desktop
- Re: USERELATIONSHIP function not returning correct...
- Subscribe to RSS Feed
- Mark Topic as New
- Mark Topic as Read
- Float this Topic for Current User
- Bookmark
- Subscribe
- Printer Friendly Page
- Mark as New
- Bookmark
- Subscribe
- Mute
- Subscribe to RSS Feed
- Permalink
- Report Inappropriate Content
USERELATIONSHIP function not returning correct count
Hi !
I have an issue which i will try to explain as best i can.
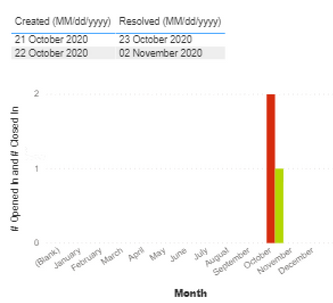
I am trying to display a clustured bar chart column showing the date a ticket was "Opened" and also the date it was "Resolved" (if indeed it has been resolved).
I have a separate Calendar table with 2 relationships to both the "Opened" Date and the "Resolved" Date. My 2 Measures are:
1) Created= Calculate(DistinctCount(Tickets[Key]), USERELATIONSHIP(Tickets[Created}, Calendar[Date})))
2) Resolved= Calculate(DistinctCount(Tickets[Key]), USERELATIONSHIP(Tickets[Resolved}, Calendar[Date})))
The "Created" measure appears to be working fine however... the "Resolved" measure is not counting all of the Resolved tickets e.g. you can see below that for October it has counted 2 X created and 1X resolved correctly... but nothing for November.
What is slightly strange is that if i change my Axis date to be for the Year - it picks up the second Resolved ticket, but not at a monthly level e.g.
Any help is greatly appreciated!
thanks
Solved! Go to Solution.
- Mark as New
- Bookmark
- Subscribe
- Mute
- Subscribe to RSS Feed
- Permalink
- Report Inappropriate Content
Thanks - removed and then re added the relationhship and now seems to work (odd!) thanks
- Mark as New
- Bookmark
- Subscribe
- Mute
- Subscribe to RSS Feed
- Permalink
- Report Inappropriate Content
@Anonymous
Can you share a sample pbix, I am not very clear why is that happened by just looking at screenshot.
Paul
- Mark as New
- Bookmark
- Subscribe
- Mute
- Subscribe to RSS Feed
- Permalink
- Report Inappropriate Content
Thanks - removed and then re added the relationhship and now seems to work (odd!) thanks
Helpful resources

Join our Fabric User Panel
This is your chance to engage directly with the engineering team behind Fabric and Power BI. Share your experiences and shape the future.

Power BI Monthly Update - June 2025
Check out the June 2025 Power BI update to learn about new features.

| User | Count |
|---|---|
| 58 | |
| 56 | |
| 56 | |
| 38 | |
| 29 |
| User | Count |
|---|---|
| 75 | |
| 62 | |
| 45 | |
| 40 | |
| 39 |


