Fabric Data Days starts November 4th!
Advance your Data & AI career with 50 days of live learning, dataviz contests, hands-on challenges, study groups & certifications and more!
Get registered- Power BI forums
- Get Help with Power BI
- Desktop
- Service
- Report Server
- Power Query
- Mobile Apps
- Developer
- DAX Commands and Tips
- Custom Visuals Development Discussion
- Health and Life Sciences
- Power BI Spanish forums
- Translated Spanish Desktop
- Training and Consulting
- Instructor Led Training
- Dashboard in a Day for Women, by Women
- Galleries
- Data Stories Gallery
- Themes Gallery
- Contests Gallery
- QuickViz Gallery
- Quick Measures Gallery
- Visual Calculations Gallery
- Notebook Gallery
- Translytical Task Flow Gallery
- TMDL Gallery
- R Script Showcase
- Webinars and Video Gallery
- Ideas
- Custom Visuals Ideas (read-only)
- Issues
- Issues
- Events
- Upcoming Events
Get Fabric Certified for FREE during Fabric Data Days. Don't miss your chance! Request now
- Power BI forums
- Forums
- Get Help with Power BI
- Desktop
- Re: Trying to create a Bubble Chart with two value...
- Subscribe to RSS Feed
- Mark Topic as New
- Mark Topic as Read
- Float this Topic for Current User
- Bookmark
- Subscribe
- Printer Friendly Page
- Mark as New
- Bookmark
- Subscribe
- Mute
- Subscribe to RSS Feed
- Permalink
- Report Inappropriate Content
Trying to create a Bubble Chart with two values
Hello,
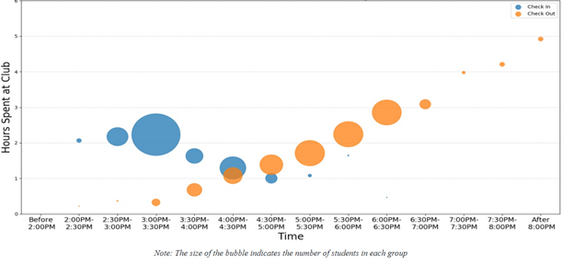
The following bubble chart was created by someone using a program that was not Power BI:
I want to recreate it but in Power BI. Here is what I have managed to do so far:
I put Check-In Time and Check-Out Time in the X-Axis but I can't get them both to show up at the same time. I can toggle between the two by drilling down, but that's now what I want. I want to see the check-in times in blue and check-out times in organe all on the same graph. Is this possible with Power BI?
Solved! Go to Solution.
- Mark as New
- Bookmark
- Subscribe
- Mute
- Subscribe to RSS Feed
- Permalink
- Report Inappropriate Content
Hi @JakeSchmetterer ,
You may go to Query Editor, select on the two columns [Check-In Time (bins)] and [Check-Out Time (bins)] in the meantime, right click to choose option "Unpivot columns", then you can rename the result column Attribute with "Check Time" ,don't forget to click button " Close & Apply" . After that, you may put [Check Time] column into Legend box .
Best Regards,
Amy
Community Support Team _ Amy
If this post helps, then please consider Accept it as the solution to help the other members find it more quickly.
- Mark as New
- Bookmark
- Subscribe
- Mute
- Subscribe to RSS Feed
- Permalink
- Report Inappropriate Content
@JakeSchmetterer - You cannot use details with x, y pairs. You would need a column or something to identify check-in or check-out and a single measure that displayed the value you want. Put the check-in/check-out column in your legend. Put your single x measure in your values.
Follow on LinkedIn
@ me in replies or I'll lose your thread!!!
Instead of a Kudo, please vote for this idea
Become an expert!: Enterprise DNA
External Tools: MSHGQM
YouTube Channel!: Microsoft Hates Greg
Latest book!: DAX For Humans
DAX is easy, CALCULATE makes DAX hard...
- Mark as New
- Bookmark
- Subscribe
- Mute
- Subscribe to RSS Feed
- Permalink
- Report Inappropriate Content
Thanks for your response. However I my check-in and check-out times are two separate columns. I can't put more than one column into Legend
- Mark as New
- Bookmark
- Subscribe
- Mute
- Subscribe to RSS Feed
- Permalink
- Report Inappropriate Content
@JakeSchmetterer , The above one is using a time bucket. And legend. Top right corner showing legend.
First, try legend, and they try a time bucket.
Time table of which you can create time bucket
https://kohera.be/blog/power-bi/how-to-create-a-time-table-in-power-bi-in-a-few-simple-steps/
- Mark as New
- Bookmark
- Subscribe
- Mute
- Subscribe to RSS Feed
- Permalink
- Report Inappropriate Content
Legend wont work beause I can't put both my check-in column and check-out column in there, it only accepts one.
I did create a Time Table and it looks like this:
This is what my other table looks like:
I have connected them as such:
But I cannot figure out how to make this graph work... This is what I have:
Helpful resources

Fabric Data Days
Advance your Data & AI career with 50 days of live learning, contests, hands-on challenges, study groups & certifications and more!

Power BI Monthly Update - October 2025
Check out the October 2025 Power BI update to learn about new features.


