Join us at FabCon Vienna from September 15-18, 2025
The ultimate Fabric, Power BI, SQL, and AI community-led learning event. Save €200 with code FABCOMM.
Get registered- Power BI forums
- Get Help with Power BI
- Desktop
- Service
- Report Server
- Power Query
- Mobile Apps
- Developer
- DAX Commands and Tips
- Custom Visuals Development Discussion
- Health and Life Sciences
- Power BI Spanish forums
- Translated Spanish Desktop
- Training and Consulting
- Instructor Led Training
- Dashboard in a Day for Women, by Women
- Galleries
- Data Stories Gallery
- Themes Gallery
- Contests Gallery
- Quick Measures Gallery
- Notebook Gallery
- Translytical Task Flow Gallery
- TMDL Gallery
- R Script Showcase
- Webinars and Video Gallery
- Ideas
- Custom Visuals Ideas (read-only)
- Issues
- Issues
- Events
- Upcoming Events
Compete to become Power BI Data Viz World Champion! First round ends August 18th. Get started.
- Power BI forums
- Forums
- Get Help with Power BI
- Desktop
- Trouble Grouping records in a matrix
- Subscribe to RSS Feed
- Mark Topic as New
- Mark Topic as Read
- Float this Topic for Current User
- Bookmark
- Subscribe
- Printer Friendly Page
- Mark as New
- Bookmark
- Subscribe
- Mute
- Subscribe to RSS Feed
- Permalink
- Report Inappropriate Content
Trouble Grouping records in a matrix
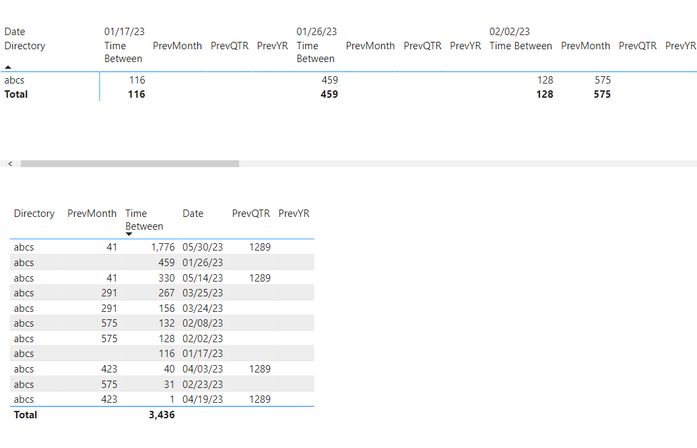
Hi, I have a list of records that I am trying to group by month.
Right now, i have a table below that shows the detail of each record. The prevMonth is correct and the data shows everything properly. Here's the formula I'm using
Everything is calculating as expected but if I try to group by Month, I visually lose the data in The PrevMonth Column.
My goal is that when I group by Month, the matrix above would show the aggregated result;
Any ideas?
Thanks, Steve
Solved! Go to Solution.
- Mark as New
- Bookmark
- Subscribe
- Mute
- Subscribe to RSS Feed
- Permalink
- Report Inappropriate Content
You are grouping by week, not by month. Weeks and months are not compatible.
Please provide sample data (with sensitive information removed) that covers your issue or question completely, in a usable format (not as a screenshot).
https://community.fabric.microsoft.com/t5/Community-Blog/How-to-provide-sample-data-in-the-Power-BI-...
Please show the expected outcome based on the sample data you provided.
https://community.fabric.microsoft.com/t5/Desktop/How-to-Get-Your-Question-Answered-Quickly/m-p/1447...
- Mark as New
- Bookmark
- Subscribe
- Mute
- Subscribe to RSS Feed
- Permalink
- Report Inappropriate Content
I"ll have to pass on this then. I'm currently unable to provide the details of this specific issue. But I appreciate the effort!
- Mark as New
- Bookmark
- Subscribe
- Mute
- Subscribe to RSS Feed
- Permalink
- Report Inappropriate Content
You are grouping by week, not by month. Weeks and months are not compatible.
Please provide sample data (with sensitive information removed) that covers your issue or question completely, in a usable format (not as a screenshot).
https://community.fabric.microsoft.com/t5/Community-Blog/How-to-provide-sample-data-in-the-Power-BI-...
Please show the expected outcome based on the sample data you provided.
https://community.fabric.microsoft.com/t5/Desktop/How-to-Get-Your-Question-Answered-Quickly/m-p/1447...


