FabCon is coming to Atlanta
Join us at FabCon Atlanta from March 16 - 20, 2026, for the ultimate Fabric, Power BI, AI and SQL community-led event. Save $200 with code FABCOMM.
Register now!- Power BI forums
- Get Help with Power BI
- Desktop
- Service
- Report Server
- Power Query
- Mobile Apps
- Developer
- DAX Commands and Tips
- Custom Visuals Development Discussion
- Health and Life Sciences
- Power BI Spanish forums
- Translated Spanish Desktop
- Training and Consulting
- Instructor Led Training
- Dashboard in a Day for Women, by Women
- Galleries
- Data Stories Gallery
- Themes Gallery
- Contests Gallery
- QuickViz Gallery
- Quick Measures Gallery
- Visual Calculations Gallery
- Notebook Gallery
- Translytical Task Flow Gallery
- TMDL Gallery
- R Script Showcase
- Webinars and Video Gallery
- Ideas
- Custom Visuals Ideas (read-only)
- Issues
- Issues
- Events
- Upcoming Events
The Power BI Data Visualization World Championships is back! Get ahead of the game and start preparing now! Learn more
- Power BI forums
- Forums
- Get Help with Power BI
- Desktop
- Transform DAX function into a Power Query function
- Subscribe to RSS Feed
- Mark Topic as New
- Mark Topic as Read
- Float this Topic for Current User
- Bookmark
- Subscribe
- Printer Friendly Page
- Mark as New
- Bookmark
- Subscribe
- Mute
- Subscribe to RSS Feed
- Permalink
- Report Inappropriate Content
Transform DAX function into a Power Query function
Hi all,
I need to use the following DAX function in a Power Query custom column since I get a "circular dependency" when trying to relate an index column to the calculated one.
Period =
CALCULATE(
    VALUES('Time Periods'[Time Period Code]),
    FILTER(
        'Time Periods',
        'Time Periods'[Start Date] >= EARLIER( 'Due Dates Cube'[Due Date] )
        && 'Time Periods'[End Date] <= EARLIER( 'Due Dates Cube'[Due Date] )
    )
)
How would you achieve this goal? Thanks in advance.
Regards,
Martin
Solved! Go to Solution.
- Mark as New
- Bookmark
- Subscribe
- Mute
- Subscribe to RSS Feed
- Permalink
- Report Inappropriate Content
Hey,
I'm wondering what you want to achieve, your DAX formula look somewhat odd.
Basically VALUES() returns a table, if this table contains just one row and one column its result can be automatically converted to a scalar value. Based on the filter I would guess that in some conditions it could be possible that there are more rows than just one.
For this reason, can you please explain in more detail what you want to achieve and you may also consider to provide an xlsx file with sample data, upload the file to onedrive or dropbox and share the link.
Regards,
Tom
Did I answer your question? Mark my post as a solution, this will help others!
Proud to be a Super User!
I accept Kudos 😉
Hamburg, Germany
- Mark as New
- Bookmark
- Subscribe
- Mute
- Subscribe to RSS Feed
- Permalink
- Report Inappropriate Content
Thank you for replying. I just solved by using another way (a non-best practice one).
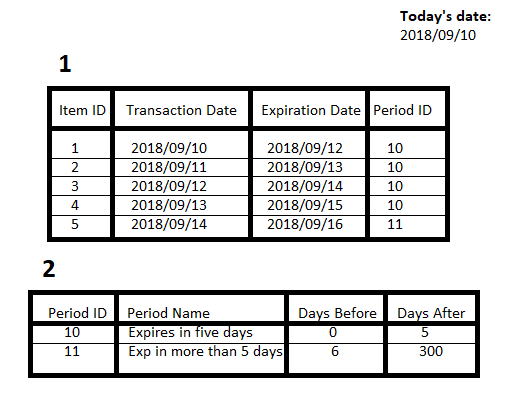
But, just in case, I needed to evaluate a "expiration date" column based on two columns from another table like (days before and days after😞
According to previous image, I wanted to calculate '1st table'[Period ID] where '1st table'[Expiration Date] is between Duration.Days(DateTime.LocalNow()) + '2nd table'[Days Before] and Duration.Days(DateTime.LocalNow()) + '2nd table Days After'.
But I just deleted Days before and Days after columns, to add a conditional column "Period ID" to do the calculation manually.
- Mark as New
- Bookmark
- Subscribe
- Mute
- Subscribe to RSS Feed
- Permalink
- Report Inappropriate Content
Hey,
I'm wondering what you want to achieve, your DAX formula look somewhat odd.
Basically VALUES() returns a table, if this table contains just one row and one column its result can be automatically converted to a scalar value. Based on the filter I would guess that in some conditions it could be possible that there are more rows than just one.
For this reason, can you please explain in more detail what you want to achieve and you may also consider to provide an xlsx file with sample data, upload the file to onedrive or dropbox and share the link.
Regards,
Tom
Did I answer your question? Mark my post as a solution, this will help others!
Proud to be a Super User!
I accept Kudos 😉
Hamburg, Germany
- Mark as New
- Bookmark
- Subscribe
- Mute
- Subscribe to RSS Feed
- Permalink
- Report Inappropriate Content
Thank you for replying. I just solved by using another way (a non-best practice one).
But, just in case, I needed to evaluate a "expiration date" column based on two columns from another table like (days before and days after😞
According to previous image, I wanted to calculate '1st table'[Period ID] where '1st table'[Expiration Date] is between Duration.Days(DateTime.LocalNow()) + '2nd table'[Days Before] and Duration.Days(DateTime.LocalNow()) + '2nd table Days After'.
But I just deleted Days before and Days after columns, to add a conditional column "Period ID" to do the calculation manually.
Helpful resources

Power BI Dataviz World Championships
The Power BI Data Visualization World Championships is back! Get ahead of the game and start preparing now!

Power BI Monthly Update - November 2025
Check out the November 2025 Power BI update to learn about new features.

| User | Count |
|---|---|
| 66 | |
| 44 | |
| 40 | |
| 29 | |
| 19 |
| User | Count |
|---|---|
| 200 | |
| 129 | |
| 103 | |
| 72 | |
| 56 |

