
Get certified for free when you join Fabric Data Days 2026 and dive into Fabric, Power BI, SQL, AI, and other essential data skills.
Join nowJuly 28 - August 9 | Final Round of the Power BI Dataviz World Championships. This is your chance. Learn more
I have a list of Projects, each of them have a Start Date.
Each month a Project Report is due for all running Projects (Project Start Date < Period EoM).
Business wants to track Projects not having the expected reports.
Data are shown below.
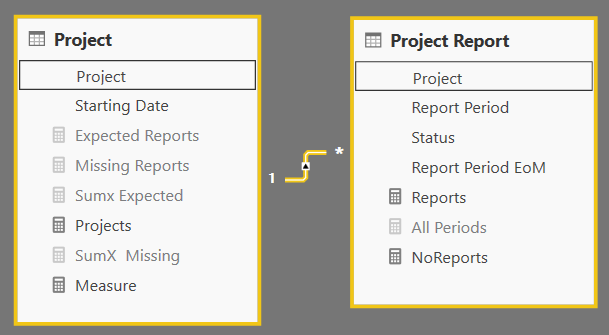
Data Model is as below
The tricky part is to calculate the measure 'Expected Report'.
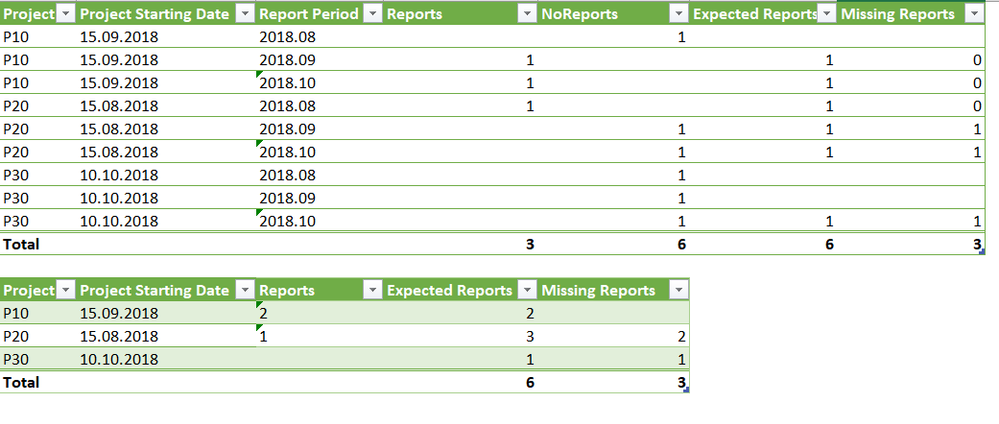
The expected result look like below
I have tried with the Lost Custormer Approach from the New and Returning Customers pattern.
Without success ...
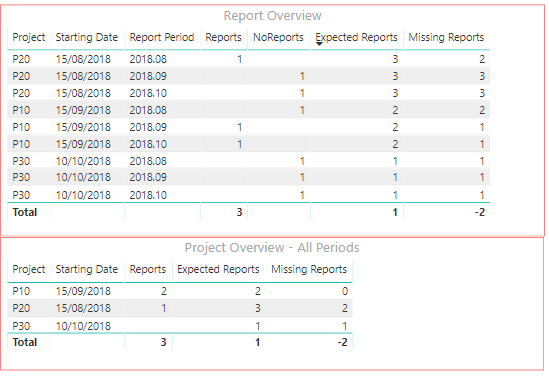
Result so far in power BI, values are wrong, total are wrong
Any idea how to solve this challenge ?
Please have a look to the shared report
Hi @Grumelo,
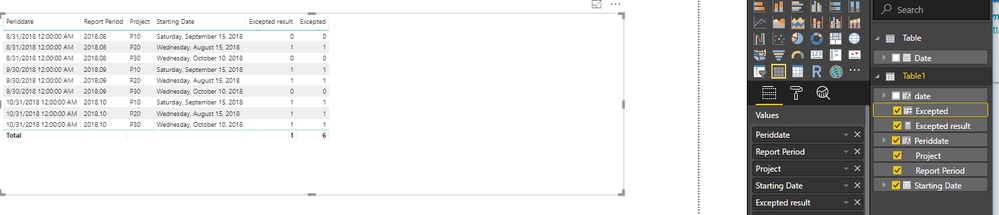
One sample for your reference.
1. Create two calculated column based on the sample table.
date = DATE(LEFT(Table1[Report Period],4),RIGHT(Table1[Report Period],2),1)
Periddate = EOMONTH(Table1[date],0)
2. Create a measure to achieve the goal.
Excepted result = IF(MAX(Table1[Starting Date])<=MAX(Table1[Periddate]),1,0)
3. Also we can use a calculated column to work on it.
Excepted = IF(Table1[Starting Date]<=Table1[Periddate],1,0)
For more detials, please check the pbix as attached.
Regards,
Frank
Data can't be manipulated, data model (edited original post) can't change.
Sample report is shared in the Topic message.
Join us in Barcelona for FabCon and SQLCon, the Fabric, Power BI, SQL, and AI community event. Save €200 with code FABCMTY200.
If you love stickers, then you will definitely want to check out our community sticker challenge, Barcelona edition!
Check out the July 2026 Power BI update to learn about new features.
| User | Count |
|---|---|
| 30 | |
| 28 | |
| 25 | |
| 24 | |
| 16 |
| User | Count |
|---|---|
| 48 | |
| 32 | |
| 17 | |
| 16 | |
| 16 |