FabCon is coming to Atlanta
Join us at FabCon Atlanta from March 16 - 20, 2026, for the ultimate Fabric, Power BI, AI and SQL community-led event. Save $200 with code FABCOMM.
Register now!- Power BI forums
- Get Help with Power BI
- Desktop
- Service
- Report Server
- Power Query
- Mobile Apps
- Developer
- DAX Commands and Tips
- Custom Visuals Development Discussion
- Health and Life Sciences
- Power BI Spanish forums
- Translated Spanish Desktop
- Training and Consulting
- Instructor Led Training
- Dashboard in a Day for Women, by Women
- Galleries
- Data Stories Gallery
- Themes Gallery
- Contests Gallery
- QuickViz Gallery
- Quick Measures Gallery
- Visual Calculations Gallery
- Notebook Gallery
- Translytical Task Flow Gallery
- TMDL Gallery
- R Script Showcase
- Webinars and Video Gallery
- Ideas
- Custom Visuals Ideas (read-only)
- Issues
- Issues
- Events
- Upcoming Events
The Power BI Data Visualization World Championships is back! Get ahead of the game and start preparing now! Learn more
- Power BI forums
- Forums
- Get Help with Power BI
- Desktop
- Text box with action/button with text
- Subscribe to RSS Feed
- Mark Topic as New
- Mark Topic as Read
- Float this Topic for Current User
- Bookmark
- Subscribe
- Printer Friendly Page
- Mark as New
- Bookmark
- Subscribe
- Mute
- Subscribe to RSS Feed
- Permalink
- Report Inappropriate Content
Text box with action/button with text
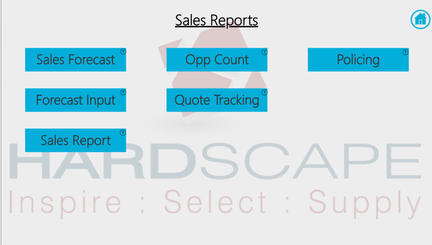
I have been utilising different buttons and bookmarks in my report to provide an app like experience for report users. Some buttons like the home icon are simple and self explanatory however there are some where I need to use a textbox for it, see menu page below for example. Currently the only way I know how to make this work is to have a text box with a background and then put a shape over it with no background or line with the action assigned. It would be ideal if I could achieve this with 1 visual!
Cheers,
Josh
- Mark as New
- Bookmark
- Subscribe
- Mute
- Subscribe to RSS Feed
- Permalink
- Report Inappropriate Content
@JoshSHardscape
The best alternative is to use Snipping Tool or Paint (whichever captures the best image quality for you), create an image of the desired shapes, and insert these images back into the report.
Bookmark actions can easily be assigned to these images with tooltip information, etc.
Hope this helps!
- Mark as New
- Bookmark
- Subscribe
- Mute
- Subscribe to RSS Feed
- Permalink
- Report Inappropriate Content
Hi @JoshSHardscape,
You can use Normal Slicer filter, just create a data table using Enter Data in Power BI Desktop, then create a Slicer and change the Slicer format > General > Orientation to Horizontal, and that should do that job.
But the only thing is, this will work as Slicer not as a bookmark. If you need bookmars then you need to use the Buttons only, becuase they have Action property.

- Mark as New
- Bookmark
- Subscribe
- Mute
- Subscribe to RSS Feed
- Permalink
- Report Inappropriate Content
Hey,
basically I'm using Affinity Designer to create "images" that contain text.
Maybe this gives you an idea.
Regards,
Tom
Did I answer your question? Mark my post as a solution, this will help others!
Proud to be a Super User!
I accept Kudos 😉
Hamburg, Germany
- Mark as New
- Bookmark
- Subscribe
- Mute
- Subscribe to RSS Feed
- Permalink
- Report Inappropriate Content
I think if I had to go this far then it would be easier to make these images in paint or something and just assign the action to them? Although I was hoping to keep it all in BI and not have to hop into other programs to help out!
Helpful resources

Power BI Dataviz World Championships
The Power BI Data Visualization World Championships is back! Get ahead of the game and start preparing now!

| User | Count |
|---|---|
| 37 | |
| 36 | |
| 33 | |
| 31 | |
| 29 |
| User | Count |
|---|---|
| 132 | |
| 86 | |
| 85 | |
| 68 | |
| 64 |


