- Subscribe to RSS Feed
- Mark Topic as New
- Mark Topic as Read
- Float this Topic for Current User
- Bookmark
- Subscribe
- Printer Friendly Page
- Mark as New
- Bookmark
- Subscribe
- Mute
- Subscribe to RSS Feed
- Permalink
- Report Inappropriate Content
Target not Displaying Correctly with Linear Gauge by MAQ Software
I'm using the Linear Gauge to show spend progress towards a set of targets (one for each business area), and I'm breaking the spending down between multiple categories (currently two, though items in a third category will exist in the future). When I added a Category value, my target value for each business area doubled, which caused confusion because I need it to be constant regardless of the number of categories I'm using to break down spending.
As a workaround, I added a DAX column that divides the target value by the number of categories where spending exists in that business area.
However, when I apply slicers to see different segments of spending within a business area, the number of categories of spending is sometimes reduced to 1. When that happens, my target is suddenly cut in half.
This element of the linear gauge - that it multiplies the target value by the number of different values for Category - is most unhelpful. Is there a way to consistently work around this limitation?
I did attempt to work around it by using a measure instead of a DAX column, but then the target just doesn't display at all.
Another solution I'm considering is adding $0.01 placeholders so that no matter how I slice the total, there is always something in each category. But that would be cumbersome to maintain and could cause visual confusion. So a better solution would be much appreciated.
Solved! Go to Solution.
- Mark as New
- Bookmark
- Subscribe
- Mute
- Subscribe to RSS Feed
- Permalink
- Report Inappropriate Content
Thanks. In this instance, that behavior is unhelpful, even if expected. But I've worked around it by adding an additional table listing the Pmt Category values, and with a measure that sums 0+ the amount while filtering using the SELECTEDVALUE() formula for the appropriate stage. I then used the Pmt Category value on that table as the Category, and the measure as the Actual Value. That way, the number of distinct Pmt Category values never changes based on slicing the data in various ways, so I can set the target as the actual target divided by the total number of distinct values for Pmt Category.
- Mark as New
- Bookmark
- Subscribe
- Mute
- Subscribe to RSS Feed
- Permalink
- Report Inappropriate Content
Hello @ivan_larson_cki ,
Linear Gauge by MAQ Software visual allows you to include multiple data points when column is present in category field.
When you drag column in category data field, it contains multiple rows with same target column.
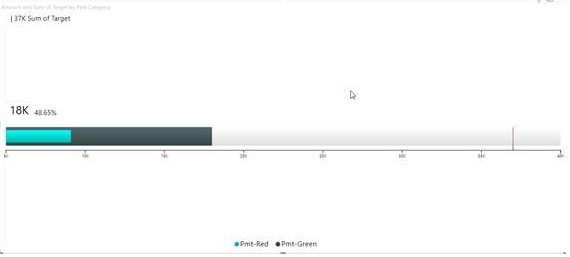
Sum of Target including both categories will be 37K.
It is the expected behavior of the visual.
If you still face any issues, please contact us at support@maqsoftware.com
Thanks
- Mark as New
- Bookmark
- Subscribe
- Mute
- Subscribe to RSS Feed
- Permalink
- Report Inappropriate Content
Thanks. In this instance, that behavior is unhelpful, even if expected. But I've worked around it by adding an additional table listing the Pmt Category values, and with a measure that sums 0+ the amount while filtering using the SELECTEDVALUE() formula for the appropriate stage. I then used the Pmt Category value on that table as the Category, and the measure as the Actual Value. That way, the number of distinct Pmt Category values never changes based on slicing the data in various ways, so I can set the target as the actual target divided by the total number of distinct values for Pmt Category.
- Mark as New
- Bookmark
- Subscribe
- Mute
- Subscribe to RSS Feed
- Permalink
- Report Inappropriate Content
hi @ivan_larson_cki,
I would really appriciate if you can share how you created the additional table and the measure to solve this issue. I am not very experienced in DAX so any guidance would be really helpful 🙂
Many thanks,
Mohammad
- Mark as New
- Bookmark
- Subscribe
- Mute
- Subscribe to RSS Feed
- Permalink
- Report Inappropriate Content
Could you please share more details about your requirement and share some sample data?
Regards,
Jimmy Tao
- Mark as New
- Bookmark
- Subscribe
- Mute
- Subscribe to RSS Feed
- Permalink
- Report Inappropriate Content
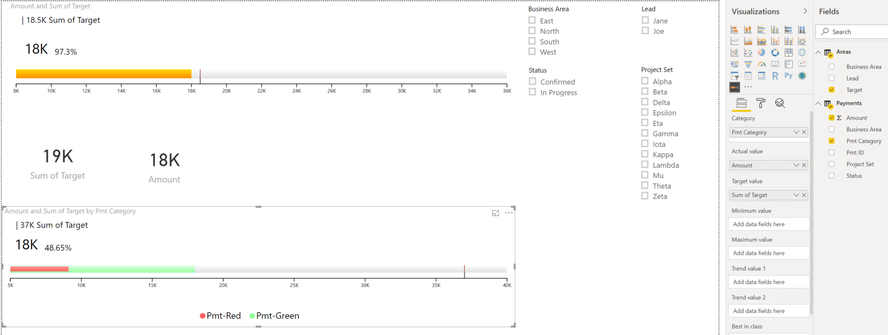
@v-yuta-msft Sure! Using the data below, I made these visuals:
The target here should be 18.5k, which is displayed correctly in the top linear gauge. In the bottom linear gauge, I added Pmt Category to the Category section of the linear gauge, and the target amount doubled to 37k.
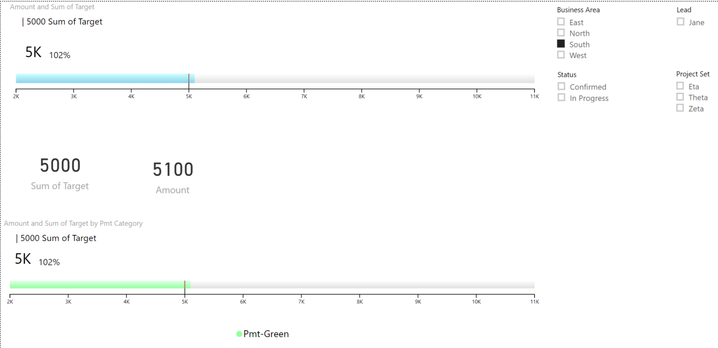
If I slice the data so that only one category applies, the Target is no longer doubled:
If I only needed to slice by values on the Areas table, I could work around this limitation, but I also need to slice by values on the Payments table (and in the live data, other intermediary tables):
Sample Summarization with Targets:
| Business Area | Lead | Target |
| North | Joe | 4500 |
| South | Jane | 5000 |
| East | Jane | 4000 |
| West | Joe | 5000 |
Sample Payment Data (related by Business Area):
| Pmt ID | Amount | Pmt Category | Business Area | Project Set | Status |
| P-101 | 700 | Pmt-Green | North | Alpha | In Progress |
| P-102 | 100 | Pmt-Red | North | Alpha | In Progress |
| P-103 | 700 | Pmt-Green | North | Alpha | In Progress |
| P-104 | 100 | Pmt-Red | North | Alpha | In Progress |
| P-105 | 200 | Pmt-Green | North | Alpha | In Progress |
| P-106 | 200 | Pmt-Red | North | Beta | Confirmed |
| P-107 | 700 | Pmt-Red | North | Beta | Confirmed |
| P-108 | 400 | Pmt-Red | North | Beta | Confirmed |
| P-109 | 800 | Pmt-Red | North | Beta | Confirmed |
| P-110 | 100 | Pmt-Red | North | Beta | Confirmed |
| P-111 | 200 | Pmt-Green | East | Gamma | In Progress |
| P-112 | 200 | Pmt-Green | East | Gamma | In Progress |
| P-113 | 800 | Pmt-Green | East | Gamma | In Progress |
| P-114 | 300 | Pmt-Green | East | Gamma | In Progress |
| P-115 | 500 | Pmt-Green | East | Delta | Confirmed |
| P-116 | 200 | Pmt-Red | East | Delta | Confirmed |
| P-117 | 200 | Pmt-Green | East | Delta | Confirmed |
| P-118 | 400 | Pmt-Red | East | Delta | Confirmed |
| P-119 | 500 | Pmt-Red | East | Epsilon | Confirmed |
| P-120 | 300 | Pmt-Red | East | Epsilon | Confirmed |
| P-121 | 400 | Pmt-Green | South | Zeta | In Progress |
| P-122 | 1000 | Pmt-Green | South | Zeta | In Progress |
| P-123 | 300 | Pmt-Green | South | Zeta | In Progress |
| P-124 | 100 | Pmt-Green | South | Zeta | In Progress |
| P-125 | 100 | Pmt-Green | South | Eta | Confirmed |
| P-126 | 900 | Pmt-Green | South | Eta | Confirmed |
| P-127 | 1000 | Pmt-Green | South | Eta | Confirmed |
| P-128 | 200 | Pmt-Green | South | Eta | Confirmed |
| P-129 | 400 | Pmt-Green | South | Theta | Confirmed |
| P-130 | 700 | Pmt-Green | South | Theta | Confirmed |
| P-131 | 700 | Pmt-Red | West | Iota | In Progress |
| P-132 | 500 | Pmt-Red | West | Iota | In Progress |
| P-133 | 200 | Pmt-Red | West | Iota | In Progress |
| P-134 | 300 | Pmt-Red | West | Iota | In Progress |
| P-135 | 1000 | Pmt-Red | West | Kappa | In Progress |
| P-136 | 1000 | Pmt-Red | West | Kappa | In Progress |
| P-137 | 600 | Pmt-Red | West | Kappa | In Progress |
| P-138 | 100 | Pmt-Red | West | Lambda | Confirmed |
| P-139 | 300 | Pmt-Red | West | Lambda | Confirmed |
| P-140 | 600 | Pmt-Red | West | Mu | Confirmed |
Helpful resources
| Subject | Author | Posted | |
|---|---|---|---|
| 07-01-2024 04:48 AM | |||
| 07-26-2024 05:56 AM | |||
| 07-14-2022 03:47 AM | |||
| 05-30-2024 03:01 AM | |||
| 08-29-2021 08:07 PM |
| User | Count |
|---|---|
| 109 | |
| 90 | |
| 82 | |
| 55 | |
| 46 |


