Join us at FabCon Vienna from September 15-18, 2025
The ultimate Fabric, Power BI, SQL, and AI community-led learning event. Save €200 with code FABCOMM.
Get registered- Power BI forums
- Get Help with Power BI
- Desktop
- Service
- Report Server
- Power Query
- Mobile Apps
- Developer
- DAX Commands and Tips
- Custom Visuals Development Discussion
- Health and Life Sciences
- Power BI Spanish forums
- Translated Spanish Desktop
- Training and Consulting
- Instructor Led Training
- Dashboard in a Day for Women, by Women
- Galleries
- Data Stories Gallery
- Themes Gallery
- Contests Gallery
- Quick Measures Gallery
- Notebook Gallery
- Translytical Task Flow Gallery
- TMDL Gallery
- R Script Showcase
- Webinars and Video Gallery
- Ideas
- Custom Visuals Ideas (read-only)
- Issues
- Issues
- Events
- Upcoming Events
Compete to become Power BI Data Viz World Champion! First round ends August 18th. Get started.
- Power BI forums
- Forums
- Get Help with Power BI
- Desktop
- Re: Table with two value-columns and their delta
- Subscribe to RSS Feed
- Mark Topic as New
- Mark Topic as Read
- Float this Topic for Current User
- Bookmark
- Subscribe
- Printer Friendly Page
- Mark as New
- Bookmark
- Subscribe
- Mute
- Subscribe to RSS Feed
- Permalink
- Report Inappropriate Content
Table with two value-columns and their delta
Hello guys,
I´m trying to create a table showing information of one week and previous week (it can also be month, this is not relevant) together with its delta. The idea is to create something like this:
| Calendar Week 30 | Calendar Week 31 | Δ% | |
| Net Order Volume | 15.000 | 16.500 | 10% |
| Shipping | 1.000 | 800 | -20% |
| Total Net Order Volume | 16.000 | 17.300 | 8% |
Unfortunately I only get to have the weeks on the left side as rows (where the KPIs are), but not as columns, so that under each week I can show not only Net Order Volume but also number of orders, number of items ordered, or some other KPIs. Any idea?
Thanks a lot for your help!
Best regards,
Borja
- Mark as New
- Bookmark
- Subscribe
- Mute
- Subscribe to RSS Feed
- Permalink
- Report Inappropriate Content
You may refer to the following DAX that creates a new table.
Table =
ADDCOLUMNS (
    GROUPBY (
        Table1,
        Table1[KPI],
        "Calendar Week 30", SUMX ( CURRENTGROUP (), IF ( Table1[Calendar Week] = 30, Table1[Volume], 0 ) ),
        "Calendar Week 31", SUMX ( CURRENTGROUP (), IF ( Table1[Calendar Week] = 31, Table1[Volume], 0 ) )
    ),
    "Δ%", DIVIDE ( [Calendar Week 31] - [Calendar Week 30], [Calendar Week 30] )
)
If this post helps, then please consider Accept it as the solution to help the other members find it more quickly.
- Mark as New
- Bookmark
- Subscribe
- Mute
- Subscribe to RSS Feed
- Permalink
- Report Inappropriate Content
Thanks @v-chuncz-msft!
I think I didn´t express myself correctly... I said I wanted a table (indeed, that´s what I want...) but I suppose the correct name for that would be a "Table-Visual"... If I understood correctly, your solution would create me a new table, right?
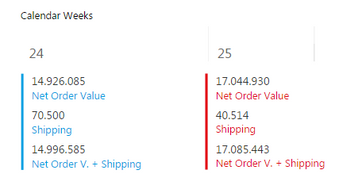
I have created this (see below) for a similar purpose using 3 card-visuals and a rectangle... the idea would be to create something similar but not so "rudimentary" (if possible), so that I can have few different KPIs under each "column" (be it YTD vs PYTD, be it CW31 vs CW30...)
Sorry for the confusion! and thanks a lot again!
Borja
- Mark as New
- Bookmark
- Subscribe
- Mute
- Subscribe to RSS Feed
- Permalink
- Report Inappropriate Content
Hello guys,
regarding this topic I thought I could do something like this...
I´ve created a Slicer with the Calendar Weeks (CW) and besides that I´ve created a column in the Dates-Table that gives me automatically the week before (very simple: when I select the CW25, it gives me the CW24 etc.).

My first solution it´s been to create two slicers and "unlock" each "Multirow Card" from the week I don´t want it to be influenced by... but I find it a bit too messy.

In order to optimize it a bit, I would like to create a measure which reacts not to the week selected on the slicer (I want to have only one) but to the value corresponding to "the week selected on the Slicer -1 (minus one)".
I have created this formula: "Net Order Value PW = CALCULATE(SUM('DATAVALUES'[Net Order Value]);CW[PCW])" but unfortunately it´s not working properly... ![]()
Would you guys have an idea of how the DAX function should look like in this case? Thanks!!
Borja
- Mark as New
- Bookmark
- Subscribe
- Mute
- Subscribe to RSS Feed
- Permalink
- Report Inappropriate Content
I´ve tried with the solution from @v-ljerr-msft from this thread: (https://community.powerbi.com/t5/Desktop/Cards-to-show-previous-period-and-or-exclude-current-period...). I adapted the code and got this:
Net Order Value PW =
VAR currentWeek = MAX(DATUM[Week])
VAR currentYear = MAX(DATUM[Year])
RETURN (IF(currentWeek=1;CALCULATE([Net Order Value];FILTER(ALL(DATUM);DATUM[Year]=currentYear-1 && DATUM[Week] = 52)); CALCULATE([Net Order Value];FILTER(ALL(DATUM);DATUM[Year]=currentYear
&& DATUM[Week] = currentWeek-1))))
...but unfortunately it´s not working either...
Thanks for your comments/help! 🙂


