Fabric Data Days starts November 4th!
Advance your Data & AI career with 50 days of live learning, dataviz contests, hands-on challenges, study groups & certifications and more!
Get registered- Power BI forums
- Get Help with Power BI
- Desktop
- Service
- Report Server
- Power Query
- Mobile Apps
- Developer
- DAX Commands and Tips
- Custom Visuals Development Discussion
- Health and Life Sciences
- Power BI Spanish forums
- Translated Spanish Desktop
- Training and Consulting
- Instructor Led Training
- Dashboard in a Day for Women, by Women
- Galleries
- Data Stories Gallery
- Themes Gallery
- Contests Gallery
- Quick Measures Gallery
- Visual Calculations Gallery
- Notebook Gallery
- Translytical Task Flow Gallery
- TMDL Gallery
- R Script Showcase
- Webinars and Video Gallery
- Ideas
- Custom Visuals Ideas (read-only)
- Issues
- Issues
- Events
- Upcoming Events
Join us at FabCon Atlanta from March 16 - 20, 2026, for the ultimate Fabric, Power BI, AI and SQL community-led event. Save $200 with code FABCOMM. Register now.
- Power BI forums
- Forums
- Get Help with Power BI
- Desktop
- Table Visual not showing all rows
- Subscribe to RSS Feed
- Mark Topic as New
- Mark Topic as Read
- Float this Topic for Current User
- Bookmark
- Subscribe
- Printer Friendly Page
- Mark as New
- Bookmark
- Subscribe
- Mute
- Subscribe to RSS Feed
- Permalink
- Report Inappropriate Content
Table Visual not showing all rows
I have a dataset that has a column that contains no-unique values (project codes) and in the data view it shows the multiple rows.
But if I add a table visual to the report it only show the ID value once...
I have changed the value setting to "Dont Summarise", I even tried changing the column type to "Text", but still the table visual doesnt so a true representation of the data set. Any ideas why? Thanks
Solved! Go to Solution.
- Mark as New
- Bookmark
- Subscribe
- Mute
- Subscribe to RSS Feed
- Permalink
- Report Inappropriate Content
Hi @StuartSmith ,
Try adding a column that has a different value to it, so it will replicate the values, by default it doens't show the repeated rows.
- Mark as New
- Bookmark
- Subscribe
- Mute
- Subscribe to RSS Feed
- Permalink
- Report Inappropriate Content
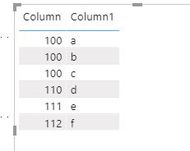
The repeated value is hidden by default. Try add other columns to the table visual to differentiate the same value of that specific column, usually they can be dates, products, type,etc.
To be clear:

Paul Zheng _ Community Support Team
If this post helps, then please consider Accept it as the solution to help the other members find it more quickly.
- Mark as New
- Bookmark
- Subscribe
- Mute
- Subscribe to RSS Feed
- Permalink
- Report Inappropriate Content
That's the grouping feature of matrix just like pivot table in Excel, duplicate values are grouped into 1 value.
- Mark as New
- Bookmark
- Subscribe
- Mute
- Subscribe to RSS Feed
- Permalink
- Report Inappropriate Content
That's the grouping feature of matrix just like pivot table in Excel, duplicate values are grouped into 1 value.
- Mark as New
- Bookmark
- Subscribe
- Mute
- Subscribe to RSS Feed
- Permalink
- Report Inappropriate Content
The repeated value is hidden by default. Try add other columns to the table visual to differentiate the same value of that specific column, usually they can be dates, products, type,etc.
To be clear:

Paul Zheng _ Community Support Team
If this post helps, then please consider Accept it as the solution to help the other members find it more quickly.
- Mark as New
- Bookmark
- Subscribe
- Mute
- Subscribe to RSS Feed
- Permalink
- Report Inappropriate Content
Hi @StuartSmith ,
Try adding a column that has a different value to it, so it will replicate the values, by default it doens't show the repeated rows.


