This is best Fabric, Power BI, SQL and AI community event. How do we know? The last event sold out! Save €200 with code FABCMTY200.
Register nowA new Data Days event is coming soon! This time we’re going bigger than ever. Fabric, Power BI, SQL, AI and more. Don't miss out.
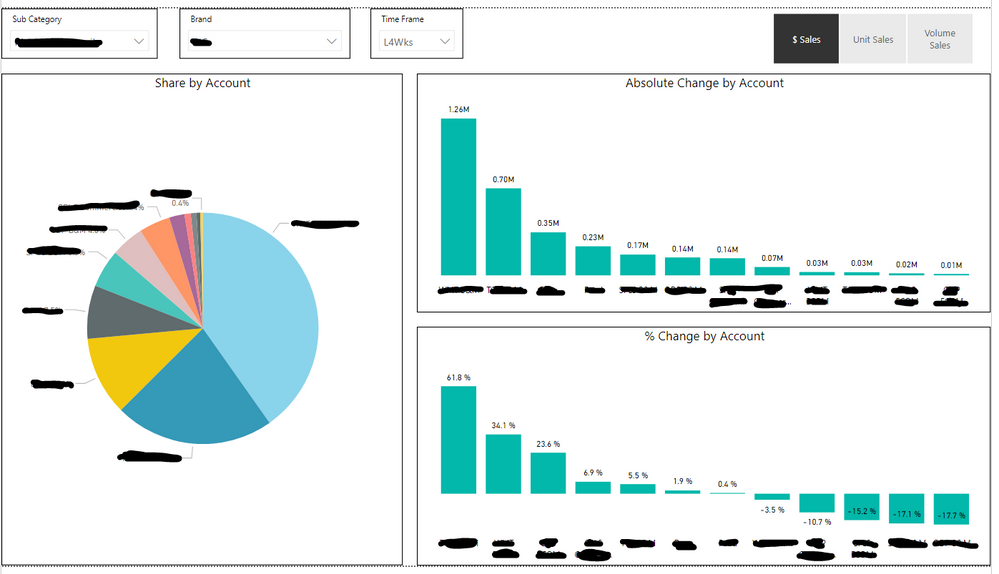
I have three graphs (shown below) that I want to be dynamic with the slicer in the top right. The slicer that I want all the graphs tied to is based on a SWITCH function for Dollars, Units, and Volume sales.
The slicer now only shows the current dollars, units, or volume, but I need it to connect to the Absolute change and % change graphs as well.
Is there a way to connect absolute change and % change to the same slicer so that the user only has to select $/Units/Volume once instead of for each chart.
Solved! Go to Solution.
hi @Anonymous
There are two way to achieve your requirement:
1. Use Switching Function in dax, please see more details as below:
Dynamically change the information within a visual via a slicer
2. use bookmark to create three states of current page as amitchandak provided.
Regards,
Lin
hi @Anonymous
There are two way to achieve your requirement:
1. Use Switching Function in dax, please see more details as below:
Dynamically change the information within a visual via a slicer
2. use bookmark to create three states of current page as amitchandak provided.
Regards,
Lin
As referred above to use measure selection function. you can try that. Similar post
But I think you might need bookmark feature to change the graph type
Refer : https://radacad.com/bookmarks-and-buttons-making-power-bi-charts-even-more-interactive
Hi @Anonymous ,
Yes, I would recommend you calculate the absolute % and % change for each slicer option ($/Units/Volume) then create a new switch function that switches between the % change depending on which slicer is selected. You could also have a second slicer that the user could toggle between absolute % and % chg.
Yes, you would create a measure for each graph that grabs SELECTEDVALUE from your slicer and then uses that as the basis for a SWITCH or SWITCH(TRUE()...) statement that would perform the correct calculation. Would need to know more about your formulas and source data and model to be more specific. Please see this post regarding How to Get Your Question Answered Quickly: https://community.powerbi.com/t5/Community-Blog/How-to-Get-Your-Question-Answered-Quickly/ba-p/38490
Check out the May 2026 Power BI update to learn about new features.
Sign up to receive a private message when registration opens and key events begin.
If you have recently started exploring Fabric, we'd love to hear how it's going. Your feedback can help with product improvements.
| User | Count |
|---|---|
| 31 | |
| 26 | |
| 23 | |
| 22 | |
| 13 |
| User | Count |
|---|---|
| 61 | |
| 47 | |
| 27 | |
| 23 | |
| 18 |