FabCon is coming to Atlanta
Join us at FabCon Atlanta from March 16 - 20, 2026, for the ultimate Fabric, Power BI, AI and SQL community-led event. Save $200 with code FABCOMM.
Register now!Go To
- Power BI forums
- Get Help with Power BI
- Desktop
- Service
- Report Server
- Power Query
- Mobile Apps
- Developer
- DAX Commands and Tips
- Custom Visuals Development Discussion
- Health and Life Sciences
- Power BI Spanish forums
- Translated Spanish Desktop
- Training and Consulting
- Instructor Led Training
- Dashboard in a Day for Women, by Women
- Galleries
- Data Stories Gallery
- Themes Gallery
- Contests Gallery
- QuickViz Gallery
- Quick Measures Gallery
- Visual Calculations Gallery
- Notebook Gallery
- Translytical Task Flow Gallery
- TMDL Gallery
- R Script Showcase
- Webinars and Video Gallery
- Ideas
- Custom Visuals Ideas (read-only)
- Issues
- Issues
- Events
- Upcoming Events
Turn on suggestions
Auto-suggest helps you quickly narrow down your search results by suggesting possible matches as you type.
Showing results for
View all the Fabric Data Days sessions on demand. View schedule
- Power BI forums
- Forums
- Get Help with Power BI
- Desktop
- Switch statement within a hierarchy - incorrect su...
Reply
Topic Options
- Subscribe to RSS Feed
- Mark Topic as New
- Mark Topic as Read
- Float this Topic for Current User
- Bookmark
- Subscribe
- Printer Friendly Page
- Mark as New
- Bookmark
- Subscribe
- Mute
- Subscribe to RSS Feed
- Permalink
- Report Inappropriate Content
Switch statement within a hierarchy - incorrect sum at first level of the hierarchy
06-25-2020
03:44 AM
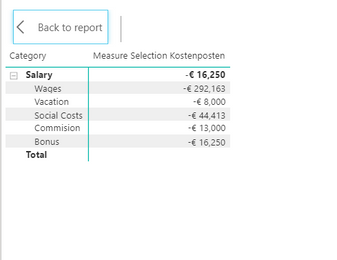
I am building up a P&L sheet and am having trouble getting the switch statement to show the correct summary -
Here is what I get and the total should be the sum of the second level of the hierarchy
CODE:
Measure Selection Kostenposten =
VAR NetSales = ROUND(CALCULATE(SUM(Kostenposten[Amount]), Kostenposten[Category III] = "Net Sales"), 0) * -1
VAR COGS = CALCULATE(SUM(Kostenposten[Amount]), Kostenposten[Category III] = "COGS") * -1
VAR GrossProfitI = NetSales + COGS
VAR MarginI = FORMAT(DIVIDE(GrossProfitI,NetSales), "Percent")
VAR Freight = CALCULATE(SUM(Kostenposten[Amount]), Kostenposten[P&L Category] = "Freight") * -1
VAR GrossProfitII = GrossProfitI + Freight
VAR MarginII = FORMAT(DIVIDE(GrossProfitII, NetSales), "Percent")
VAR Wages = CALCULATE(SUM(Kostenposten[Amount]), Kostenposten[Category III] = "Wages") * -1
VAR Vacation = CALCULATE(SUM(Kostenposten[Amount]), Kostenposten[Category III] = "Vacation") * -1
VAR Bonus = CALCULATE(SUM(Kostenposten[Amount]), Kostenposten[Category III] = "Bonus") * -1
VAR Commission = CALCULATE(SUM(Kostenposten[Amount]), Kostenposten[Category III] = "Commission") * -1
VAR SocialCosts = CALCULATE(SUM(Kostenposten[Amount]), Kostenposten[Category III] = "Social Costs") * -1
VAR Salary = CALCULATE(SUM(Kostenposten[Amount]), Kostenposten[P&L Category] = "Salary") * -1
VAR OPEX = CALCULATE(SUM(Kostenposten[Amount]), Kostenposten[P&L Category] = "OPEX") * -1
VAR EBITDA = GrossProfitII + Salary + OPEX
VAR MarginIII = FORMAT(DIVIDE(EBITDA, NetSales), "Percent")
VAR FinancialOther = CALCULATE(SUM(Kostenposten[Amount]), Kostenposten[P&L Category] = "Financial: Other") * -1
VAR EBIT = EBITDA + FinancialOther
VAR GrossMarginI = FORMAT(DIVIDE(EBIT, NetSales), "Percent")
VAR FinancialExpense = CALCULATE(SUM(Kostenposten[Amount]), Kostenposten[P&L Category] = "Financial Expense") * -1
VAR Tax = CALCULATE(SUM(Kostenposten[Amount]), Kostenposten[P&L Category] = "Tax") * -1
VAR NetIncome = EBIT + FinancialExpense + Tax
VAR GrossMarginII = FORMAT( DIVIDE(NetIncome, NetSales), "Percent")


RETURN
    IF(ISCROSSFILTERED('P&L Index'),
SWITCH( TRUE(),
    VALUES('P&L Index'[Category]) = "Net Sales", NetSales,
    VALUES('P&L Index'[Category]) = "COGS", COGS,
    VALUES('P&L Index'[Category]) = "Gross Profit I", NetSales + COGS,
    VALUES('P&L Index'[Category]) = "Margin % I", MarginI,
    VALUES('P&L Index'[Category]) = "Freight", Freight,
    VALUES('P&L Index'[Category]) = "Gross Profit II", GrossProfitII,
    VALUES('P&L Index'[Category]) = "Margin % II", MarginII,
    FIRSTNONBLANK('P&L Index'[Category II], 1) = "Wages", Wages,
    FIRSTNONBLANK('P&L Index'[Category II], 1) = "Vacation", Vacation,
    FIRSTNONBLANK('P&L Index'[Category II], 1) = "Bonus", Bonus,
    FIRSTNONBLANK('P&L Index'[Category II], 1) = "Social Costs", SocialCosts,
    FIRSTNONBLANK('P&L Index'[Category II], 1) = "Commision", Commission,
    VALUES('P&L Index'[Category]) = "Salary", Salary,
    VALUES('P&L Index'[Category]) = "OPEX", OPEX,
    VALUES('P&L Index'[Category]) = "EBITDA", EBITDA,
    VALUES('P&L Index'[Category]) = "Margin % III", MarginIII,
    VALUES('P&L Index'[Category]) = "Financial: Other", FinancialOther,
    VALUES('P&L Index'[Category]) = "EBIT", EBIT * -1,
    VALUES('P&L Index'[Category]) = "Gross Margin I", GrossMarginI,
    VALUES('P&L Index'[Category]) = "Financial Expense", FinancialExpense,
    VALUES('P&L Index'[Category]) = "Tax", Tax,
    VALUES('P&L Index'[Category]) = "Net Income", NetIncome,
    VALUES('P&L Index'[Category]) = "Gross Margin II", GrossMarginII, BLANK()), BLANK())
1 REPLY 1
- Mark as New
- Bookmark
- Subscribe
- Mute
- Subscribe to RSS Feed
- Permalink
- Report Inappropriate Content
06-25-2020
04:51 AM
Helpful resources
Announcements

Power BI Monthly Update - November 2025
Check out the November 2025 Power BI update to learn about new features.

Fabric Data Days
Advance your Data & AI career with 50 days of live learning, contests, hands-on challenges, study groups & certifications and more!

Featured Topics

