Get certified for free when you join Fabric Data Days 2026 and dive into Fabric, Power BI, SQL, AI, and other essential data skills.
Join nowJuly 28 - August 9 | Final Round of the Power BI Dataviz World Championships. This is your chance. Learn more
I have 2 date tables both with unique Dates.
1. Is a Table that displays Year and Good Friday Date
Year Good Friday
2021 04/02/2021
2022 04/15/2022
2023 04/07/2023
2, The other is a general Date table.
I am trying to create a "Holiday" column in the the Date table using "Switch"
Solved! Go to Solution.
Try someting like this for the column.
Holiday =
SWITCH (
TRUE (),
NOT ISBLANK (
LOOKUPVALUE (
'Good Friday Years'[Good Friday],
'Good Friday Years'[Good Friday], Dates[Date]
)
), "Good Friday",
""
)
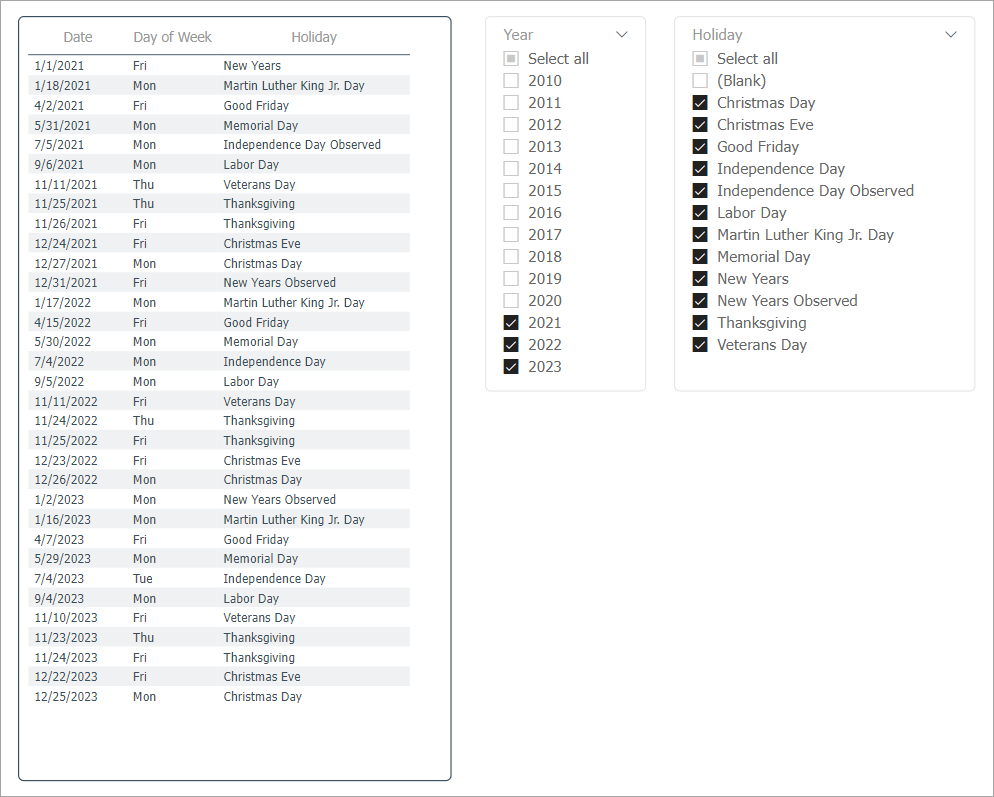
I have attached a file with a Dates table along with a Holiday table and a GoodFriday table and I use both of those to tag the holidays on the dates table. The idea for the holiday table came from this post
https://community.powerbi.com/t5/Desktop/Holiday-date-patterns/m-p/768950
It uses the day of the week as well as the day of the month of the holiday and the month to identify what dates should be tagged as holidays.
You can try something like...
Holiday =
var _goodFriday =
LOOKUPVALUE('Good Friday Years'[Good Friday], 'Good Friday Years'[Year], dimDate[Date].[Year], 'Good Friday Years'[Good Friday], dimDate[Date])
return
IF(
ISBLANK(_goodFriday),
"",
"Good Friday"
)
Proud to be a Super User! | |
Try someting like this for the column.
Holiday =
SWITCH (
TRUE (),
NOT ISBLANK (
LOOKUPVALUE (
'Good Friday Years'[Good Friday],
'Good Friday Years'[Good Friday], Dates[Date]
)
), "Good Friday",
""
)
If you love stickers, then you will definitely want to check out our community sticker challenge, Barcelona edition!
Check out the July 2026 Power BI update to learn about new features.
| User | Count |
|---|---|
| 30 | |
| 28 | |
| 23 | |
| 21 | |
| 19 |
| User | Count |
|---|---|
| 41 | |
| 32 | |
| 18 | |
| 18 | |
| 15 |