FabCon is coming to Atlanta
Join us at FabCon Atlanta from March 16 - 20, 2026, for the ultimate Fabric, Power BI, AI and SQL community-led event. Save $200 with code FABCOMM.
Register now!- Power BI forums
- Get Help with Power BI
- Desktop
- Service
- Report Server
- Power Query
- Mobile Apps
- Developer
- DAX Commands and Tips
- Custom Visuals Development Discussion
- Health and Life Sciences
- Power BI Spanish forums
- Translated Spanish Desktop
- Training and Consulting
- Instructor Led Training
- Dashboard in a Day for Women, by Women
- Galleries
- Data Stories Gallery
- Themes Gallery
- Contests Gallery
- Quick Measures Gallery
- Notebook Gallery
- Translytical Task Flow Gallery
- TMDL Gallery
- R Script Showcase
- Webinars and Video Gallery
- Ideas
- Custom Visuals Ideas (read-only)
- Issues
- Issues
- Events
- Upcoming Events
To celebrate FabCon Vienna, we are offering 50% off select exams. Ends October 3rd. Request your discount now.
- Power BI forums
- Forums
- Get Help with Power BI
- Desktop
- Re: Sum/count of true events in a measure
- Subscribe to RSS Feed
- Mark Topic as New
- Mark Topic as Read
- Float this Topic for Current User
- Bookmark
- Subscribe
- Printer Friendly Page
- Mark as New
- Bookmark
- Subscribe
- Mute
- Subscribe to RSS Feed
- Permalink
- Report Inappropriate Content
Sum/count of true events in a measure
Hi Guys
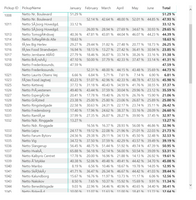
I have created a standard matrix as below. Now i would like create a table or matrix next to it showing the number of Pick IDs where the average percentage in the selected period is above 40%, below 10% and in between. I am using a date slicer.
I've tried creating a measure that returns a 1 if the average for example is above 40% but i can't find a function to counts the 1s that are returned.
Measure formula is = IF(AVERAGE('Salling Group'[Utilization %])>0,4 , 1 , 0)
Hope my question makes sense. 🙂
- Mark as New
- Bookmark
- Subscribe
- Mute
- Subscribe to RSS Feed
- Permalink
- Report Inappropriate Content
You won't want to use a measure for this, a measure is a single calculation. If you create a new matrix/table and fill it with the exact same data, you should be able to filter it based on the value of a field, like this:
- Mark as New
- Bookmark
- Subscribe
- Mute
- Subscribe to RSS Feed
- Permalink
- Report Inappropriate Content
Thanks for the reply.
That would create a table that shows alle items with an average of above 40% and the grand total would be the average of all the items.
I just need a count of all the items that has an average ov over 40%.
- Mark as New
- Bookmark
- Subscribe
- Mute
- Subscribe to RSS Feed
- Permalink
- Report Inappropriate Content
In that case, use something like:
Forty Plus Average = CALCULATE(AVERAGE('table'[field]), 'table'[average] > .4)But when you say "the grand total would be the average of all the items" that is describing the total of a table. You also said you wanted a table in your original post. Can you please clarify which one you are wanting?


