Get certified for free when you join Fabric Data Days 2026 and dive into Fabric, Power BI, SQL, AI, and other essential data skills.
Join nowJuly 7 - July 17 | Round 2 of the Power BI Dataviz World Championships. Don't miss your chance! Learn more
Hi
I'm quite new to Power BI and hoping for some advice on the best way to structure/ model data for survey analysis.
I have a survey of approximately 90 single response multi choice questions. Each question also has a subset eg Q1-3 - Health, Q 4-7 - Accommodation etc. Ultimately, I would like to analyse the data by question number and by question subset ie. if there is a 1 in any of the health questions, then 1, otherwise 0.
I currently have 3 tables - Respondent table, question table and survey table - dummy, simplified versions below. The survey is currently in tabular format. I'm wondering if this is the best format for analysis or if I should be unpivoting the data? I get a little confused with the relationships if I unpivot since there will then be multiple person IDs. Or is it easiest to create extra column with if statements? It seems like I have a lot of columns already!
Any advice would be much appreciated!
Thank you!
| Person ID | Name |
| 001 | Jo |
| 002 | Dave |
| 003 | Brian |
| 004 | Paul |
| 005 | Alan |
| Question Number | Question Subset |
| 1 | A |
| 2 | A |
| 3 | A |
| 4 | B |
| 5 | B |
| 6 | B |
| 7 | C |
| 8 | C |
| 9 | C |
| 10 | C |
| Person ID | Survey ID | 1 | 2 | 3 | 4 | 5 | 6 | 7 | 8 | 9 | 10 |
| 001 | 101 | 3 | 3 | 2 | 0 | Yes | Yes | Yes | 0 | 3 | Yes |
| 002 | 102 | 2 | 3 | 2 | 3 | No | No | No | 3 | 4 | No |
| 003 | 103 | 3 | 0 | 3 | 3 | Yes | Yes | Yes | 3 | 1 | Yes |
| 004 | 104 | 0 | 2 | 1 | 3 | Yes | Yes | Yes | 3 | 1 | Yes |
| 005 | 105 | 1 | 2 | 4 | 0 | No | No | No | 3 | 3 | No |
Solved! Go to Solution.
Hi @WBscooby ,
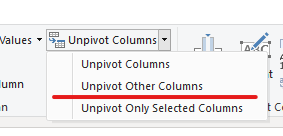
First go to query editor>select column"Person ID"and "Survey ID">"Unpivot other columns":
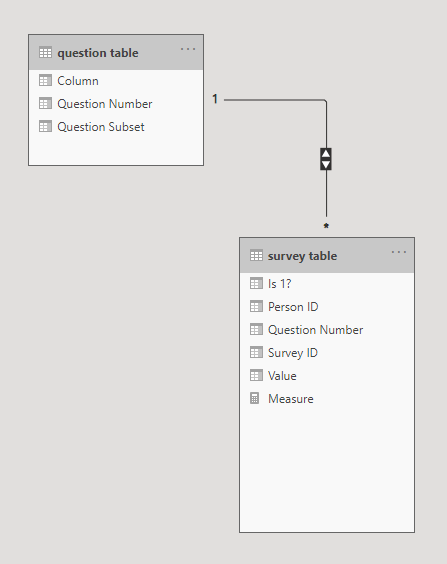
Create a relationship as below:
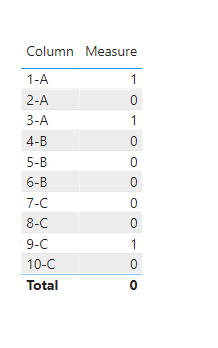
Then create a calculated column and a measure as below:
Best Regards,
Kelly
Did I answer your question? Mark my post as a solution!
Hi @WBscooby ,
First go to query editor>select column"Person ID"and "Survey ID">"Unpivot other columns":
Create a relationship as below:
Then create a calculated column and a measure as below:
Best Regards,
Kelly
Did I answer your question? Mark my post as a solution!
Thank you, this was just what I needed. Sorry for delayed response - other work priorities took over!
Hi @WBscooby
Can you describe a bit more the analysis that you would like to do on the data? What visuals, etc..
The text below is not clear enough
Ultimately, I would like to analyse the data by question number and by question subset ie. if there is a 1 in any of the health questions, then 1, otherwise 0.
Please mark the question solved when done and consider giving a thumbs up if posts are helpful.
Contact me privately for support with any larger-scale BI needs, tutoring, etc.
Cheers
Join us in Barcelona for FabCon and SQLCon, the Fabric, Power BI, SQL, and AI community event. Save €200 with code FABCMTY200.
Join Data Days 2026: 60 days of free live/on-demand sessions, challenges, study groups, and certification opportunities.
| User | Count |
|---|---|
| 30 | |
| 28 | |
| 26 | |
| 23 | |
| 17 |
| User | Count |
|---|---|
| 57 | |
| 43 | |
| 33 | |
| 24 | |
| 20 |