cancel
Showing results for 
Search instead for 
Did you mean: 

July 7 - July 17 | Round 2 of the Power BI Dataviz World Championships. Don't miss your chance! Learn more

Reply
jsBrizius
Helper I
Helper I

Sort by Measure (Pareto)?

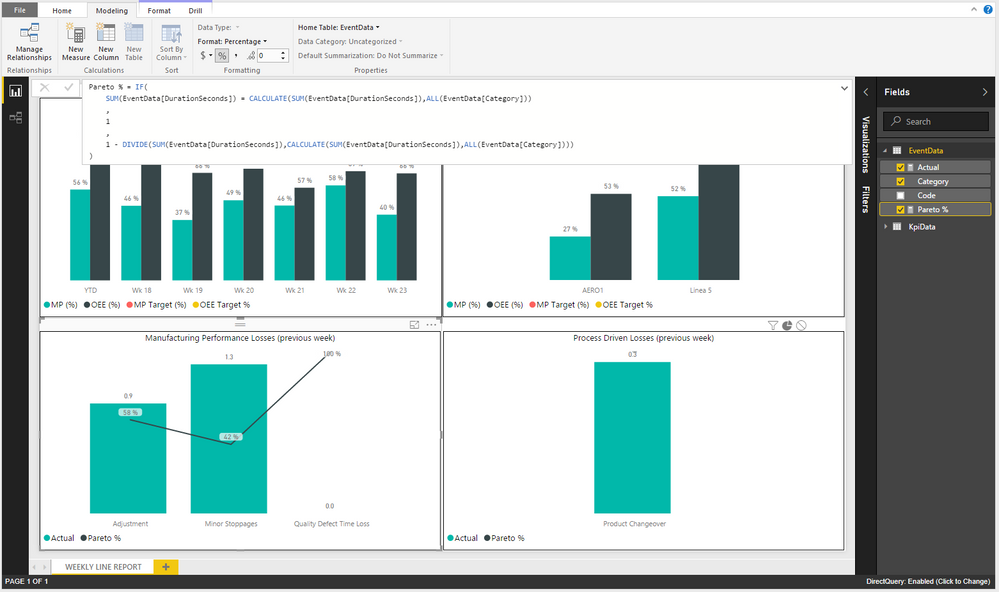
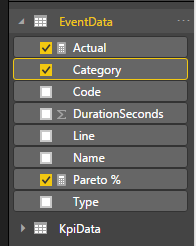
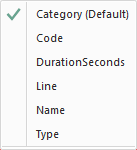
I am using the Line/Column chart as a pareto.  My problem is that it is not sorting correctly.  When I try to change the sort column for the x axis value Category, the Pareto column is not an option?


 chart.PNG


list.PNG


Sort By Column options:

menu.png

1 ACCEPTED SOLUTION
samdthompson
Memorable Member
Memorable Member

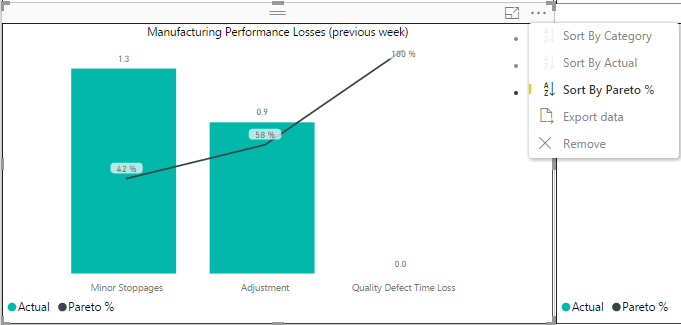
click on the 3 dots at the top right of the chart and click on sort by (whatever the measure is called).

// if this is a solution please mark as such. Kudos always appreciated.

View solution in original post

3 REPLIES 3
Mike_Carlo
Most Valuable Professional

Also check out this great tutorial of making a Pareto chart in power BI. It help me when I was having a similar issue.

http://powerbi.tips/2016/10/pareto-charting/
Mike Carlo ( https://powerbi.tips )
samdthompson
Memorable Member
Memorable Member

click on the 3 dots at the top right of the chart and click on sort by (whatever the measure is called).

// if this is a solution please mark as such. Kudos always appreciated.


That worked.


chart2.png

Helpful resources

Announcements
FabCon and SQLCon Barcelona 2026

FabCon & SQLCon – Barcelona 2026

Join us in Barcelona for FabCon and SQLCon, the Fabric, Power BI, SQL, and AI community event. Save €200 with code FABCMTY200.

60 days of Data Days Carousel

Data Days 2026

Join Fabric Data Days 2026: 60 days of free live/on-demand sessions, challenges, study groups, and certification opportunities.

Power BI DataViz World Championships carousel

Power BI DataViz World Championships - June 2026

A new Power BI DataViz World Championship is coming this June! Don't miss out on submitting your entry.