Fabric Data Days starts November 4th!
Advance your Data & AI career with 50 days of live learning, dataviz contests, hands-on challenges, study groups & certifications and more!
Get registered- Power BI forums
- Get Help with Power BI
- Desktop
- Service
- Report Server
- Power Query
- Mobile Apps
- Developer
- DAX Commands and Tips
- Custom Visuals Development Discussion
- Health and Life Sciences
- Power BI Spanish forums
- Translated Spanish Desktop
- Training and Consulting
- Instructor Led Training
- Dashboard in a Day for Women, by Women
- Galleries
- Data Stories Gallery
- Themes Gallery
- Contests Gallery
- Quick Measures Gallery
- Visual Calculations Gallery
- Notebook Gallery
- Translytical Task Flow Gallery
- TMDL Gallery
- R Script Showcase
- Webinars and Video Gallery
- Ideas
- Custom Visuals Ideas (read-only)
- Issues
- Issues
- Events
- Upcoming Events
Get Fabric Certified for FREE during Fabric Data Days. Don't miss your chance! Learn more
- Power BI forums
- Forums
- Get Help with Power BI
- Desktop
- Re: Slicer
- Subscribe to RSS Feed
- Mark Topic as New
- Mark Topic as Read
- Float this Topic for Current User
- Bookmark
- Subscribe
- Printer Friendly Page
- Mark as New
- Bookmark
- Subscribe
- Mute
- Subscribe to RSS Feed
- Permalink
- Report Inappropriate Content
Slicer
Hi, I'm fairly new to working with Power BI. I was able to create multiple visiuals and slicers, however, the slicers are not working properly. I have two slicers and two tables, i need the slicers to work independently and together to filter my visuals. I checked my connections, i tried to sync the slicers as well and even use the advanced option but the the filter options in the slicers do not filter both visuals correctly. Not sure what else today, any help/suggestions would be greatly appreciated
- Mark as New
- Bookmark
- Subscribe
- Mute
- Subscribe to RSS Feed
- Permalink
- Report Inappropriate Content
Hi @Anonymous ,
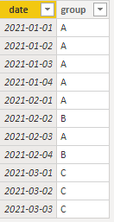
I created some data:
Table:
Table2:
The [date] column of Table and the [group] of Table2 are used as slicers, and they will affect each other.
Here are the steps you can follow:
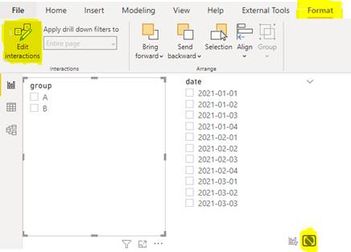
1. You can select the slicer group and open Format-Edit interactions.
2. Click on the circle that appears in another slicer.
3. Select the slicer date, open Format-Edit interactions.
4. Click on the circle that appears in another slicer.
5. So that the two slicers will not affect each other.
Best Regards,
Liu Yang
If this post helps, then please consider Accept it as the solution to help the other members find it more quickly.
- Mark as New
- Bookmark
- Subscribe
- Mute
- Subscribe to RSS Feed
- Permalink
- Report Inappropriate Content
@Anonymous Hi, the edit interation options does not pop up for the slicer. I have two separate datasets and i'm trying to link multiple slicers. All of the other slicers I have interact and filter correctly but, when I select this one slicer to drill down in the detail more, it does not work.
- Mark as New
- Bookmark
- Subscribe
- Mute
- Subscribe to RSS Feed
- Permalink
- Report Inappropriate Content
@Anonymous - Are you talking about being able to select from each slicer (selection item) as needed; CTRL + Left Click? Possibly you can share more about what you are experiencing.
Did I answer your question? Mark my post as a solution!
Did my answers help arrive at a solution? Give it a kudos by clicking the Thumbs Up!
Proud to be a Super User!
- Mark as New
- Bookmark
- Subscribe
- Mute
- Subscribe to RSS Feed
- Permalink
- Report Inappropriate Content
@ChrisMendoza wrote:@Anonymous- Are you talking about being able to select from each slicer (selection item) as needed; CTRL + Left Click? Possibly you can share more about what you are experiencing.
@ChrisMendoza Somewhat, I created two slicers to filter multiple tables. The slicers will filter each other but not both tables.
- Mark as New
- Bookmark
- Subscribe
- Mute
- Subscribe to RSS Feed
- Permalink
- Report Inappropriate Content
- Mark as New
- Bookmark
- Subscribe
- Mute
- Subscribe to RSS Feed
- Permalink
- Report Inappropriate Content
@Anonymous - Can you share your PBIX file, assuming non-confidential data? Otherwise, I think seeing your data model with the active relationships might help. Your attached images are rather small and I am unable to assist from what you have provided.
Did I answer your question? Mark my post as a solution!
Did my answers help arrive at a solution? Give it a kudos by clicking the Thumbs Up!
Proud to be a Super User!
- Mark as New
- Bookmark
- Subscribe
- Mute
- Subscribe to RSS Feed
- Permalink
- Report Inappropriate Content
@ChrisMendoza my apolgoies for the delay.
https://tcco-my.sharepoint.com/:u:/p/njordan/ERrkV6ZXL8tIhRWy_Cjmg-MB0IQTSoqw27iq7uuIBnoFQg?e=jJnmLV
- Mark as New
- Bookmark
- Subscribe
- Mute
- Subscribe to RSS Feed
- Permalink
- Report Inappropriate Content
I feel like this has something to do with the way the data type is saved (as Percentage). I feel like someone else might have better insight.
Did I answer your question? Mark my post as a solution!
Did my answers help arrive at a solution? Give it a kudos by clicking the Thumbs Up!
Proud to be a Super User!
- Mark as New
- Bookmark
- Subscribe
- Mute
- Subscribe to RSS Feed
- Permalink
- Report Inappropriate Content
- Mark as New
- Bookmark
- Subscribe
- Mute
- Subscribe to RSS Feed
- Permalink
- Report Inappropriate Content
I can't delete your post however, I did remove the images I attached.
Did I answer your question? Mark my post as a solution!
Did my answers help arrive at a solution? Give it a kudos by clicking the Thumbs Up!
Proud to be a Super User!
- Mark as New
- Bookmark
- Subscribe
- Mute
- Subscribe to RSS Feed
- Permalink
- Report Inappropriate Content
@ChrisMendoza okay, thank you very much for being patient and trying to assist me with my issue!
- Mark as New
- Bookmark
- Subscribe
- Mute
- Subscribe to RSS Feed
- Permalink
- Report Inappropriate Content
@ChrisMendoza - Can you advise how to attach the file? I've tried the URL etc and also inserting, nothing is working.
I have the PBIX report filtered for color#73. The issue is the totals for the tables are not reflecting correctly for the color totals by CO object name. Color 73 is in Finance & Management but the function totals only reflect the total values. If you select the management CO object name the function time displays correctly but the function total does not. It should be significantly less since the functoin total % is 5%. Does this make sense?
- Mark as New
- Bookmark
- Subscribe
- Mute
- Subscribe to RSS Feed
- Permalink
- Report Inappropriate Content
You'll need to share via your own OneDrive, Box, DropBox, etc.
Did I answer your question? Mark my post as a solution!
Did my answers help arrive at a solution? Give it a kudos by clicking the Thumbs Up!
Proud to be a Super User!
- Mark as New
- Bookmark
- Subscribe
- Mute
- Subscribe to RSS Feed
- Permalink
- Report Inappropriate Content

Helpful resources

Fabric Data Days
Advance your Data & AI career with 50 days of live learning, contests, hands-on challenges, study groups & certifications and more!

Power BI Monthly Update - October 2025
Check out the October 2025 Power BI update to learn about new features.


