Join us at FabCon Vienna from September 15-18, 2025
The ultimate Fabric, Power BI, SQL, and AI community-led learning event. Save €200 with code FABCOMM.
Get registered- Power BI forums
- Get Help with Power BI
- Desktop
- Service
- Report Server
- Power Query
- Mobile Apps
- Developer
- DAX Commands and Tips
- Custom Visuals Development Discussion
- Health and Life Sciences
- Power BI Spanish forums
- Translated Spanish Desktop
- Training and Consulting
- Instructor Led Training
- Dashboard in a Day for Women, by Women
- Galleries
- Data Stories Gallery
- Themes Gallery
- Contests Gallery
- Quick Measures Gallery
- Notebook Gallery
- Translytical Task Flow Gallery
- TMDL Gallery
- R Script Showcase
- Webinars and Video Gallery
- Ideas
- Custom Visuals Ideas (read-only)
- Issues
- Issues
- Events
- Upcoming Events
Enhance your career with this limited time 50% discount on Fabric and Power BI exams. Ends August 31st. Request your voucher.
- Power BI forums
- Forums
- Get Help with Power BI
- Desktop
- Re: Slice doesn't work when data labels are added?...
- Subscribe to RSS Feed
- Mark Topic as New
- Mark Topic as Read
- Float this Topic for Current User
- Bookmark
- Subscribe
- Printer Friendly Page
- Mark as New
- Bookmark
- Subscribe
- Mute
- Subscribe to RSS Feed
- Permalink
- Report Inappropriate Content
Slice doesn't work when data labels are added? (Clustered column chart)
Hi guys.
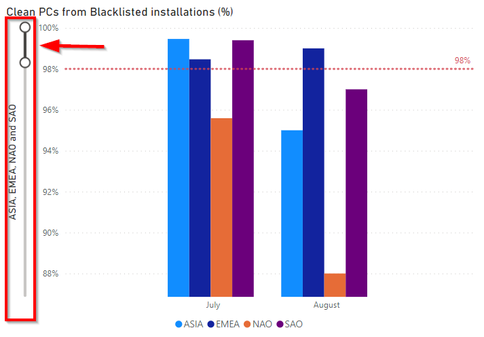
I have a KPI for computers without malicious software installed. Threshold of 98% per region. So, I'm only interested on the Y range from 90% - 100%, so I need to use a Y axis slicer to see in detail. Example:
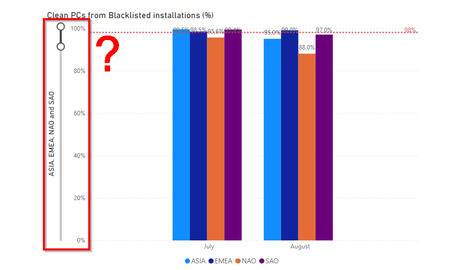
When I add data labels to the columns, the slicer simply stops working:
Can't find a way to reverse this. Is this a (known) bug? Anyone with something similar?
Thank you
- Mark as New
- Bookmark
- Subscribe
- Mute
- Subscribe to RSS Feed
- Permalink
- Report Inappropriate Content
HI @Inverno ,
I see that you are using Zoom Slider option on your y-axis. I am not sure if it intended for a purpose that you are trying to achieve.
- Mark as New
- Bookmark
- Subscribe
- Mute
- Subscribe to RSS Feed
- Permalink
- Report Inappropriate Content
Hello @Pragati11 , thank you for taking your time here.
I can squeeze the Y axis setting a minium and a maximum value, but for specific reasons I would like to have this Zoom slider (you are right) working with the data labels... Perhaps it simply does not work (Zoom slider + data labels)...
Thanks


