cancel
Showing results forย 
Search instead forย 
Did you mean:ย 

July 28 - August 9 | Final Round of the Power BI Dataviz World Championships. This is your chance. Learn more

Reply
lkshck
Helper III
Helper III

Simulate null values for missing data

Hey,

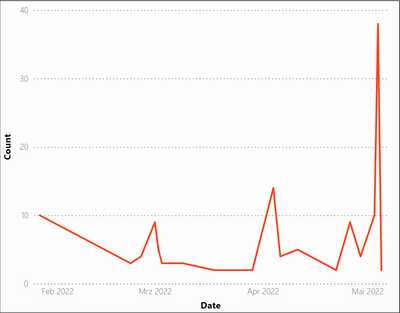
I have a table which contains a date (by day), a clientId and a count (number of requests). There are some clients which doesn't make requests for some days which leads to no data in this table. So only counts > 0 are written to it. To get a better graph I still want to have those days marked as count = 0. Is there any chance to do that in PowerBi? Currently the graphs looks like this:

lkshck_0-1654180244267.png

Goal is to have a value for everyday, so for days where I don't have any count, it should be just 0.


Best regards and thanks in advance!

1 ACCEPTED SOLUTION
Anonymous
Not applicable

Hi @lkshck ,


I suggest you to create a DimDate table by CALENDAR() or CALENDARAUTO() function. 

Date = 
CALENDAR(MIN('Table'[date]),MAX('Table'[date]))

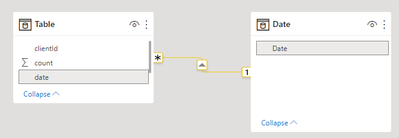
Relationship:

RicoZhou_0-1654571747345.png

Measure:

Measure = CALCULATE(SUM('Table'[count]))+0

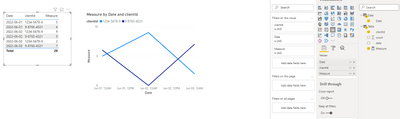
Use [Date] from DimDate table to create your visuals. Result is as below.

RicoZhou_1-1654571794692.png


Best Regards,
Rico Zhou


If this post helps, then please consider Accept it as the solution to help the other members find it more quickly.

View solution in original post

3 REPLIES 3
Syndicate_Admin
Administrator
Administrator

What you are looking for is to add a 0 as a daily goal? or is what I understood in your question! can you give an example with an excel graph of what you are looking for to help you?

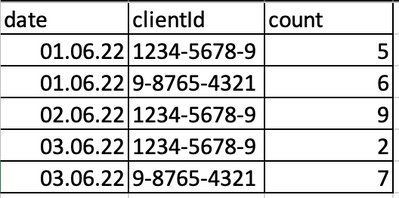
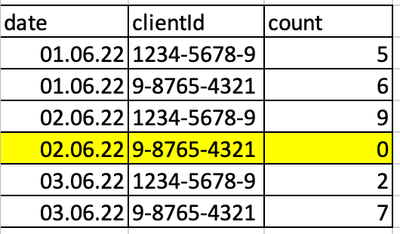
0 should be added to every day where the client made any request. So the current table looks like the following:

lkshck_0-1654247128693.png


So you can see that the client 9-8765-4321 doesn't made any calls on 02.06.2022. Goal is to add this clientId as well to this date, but with count = 0. So the expected table should look like:

lkshck_1-1654247157668.png


Anonymous
Not applicable

Hi @lkshck ,


I suggest you to create a DimDate table by CALENDAR() or CALENDARAUTO() function. 

Date = 
CALENDAR(MIN('Table'[date]),MAX('Table'[date]))

Relationship:

RicoZhou_0-1654571747345.png

Measure:

Measure = CALCULATE(SUM('Table'[count]))+0

Use [Date] from DimDate table to create your visuals. Result is as below.

RicoZhou_1-1654571794692.png


Best Regards,
Rico Zhou


If this post helps, then please consider Accept it as the solution to help the other members find it more quickly.

Helpful resources

Announcements
FabCon and SQLCon Barcelona 2026

FabCon & SQLCon โ€“ Barcelona 2026

Join us in Barcelona for FabCon and SQLCon, the Fabric, Power BI, SQL, and AI community event. Save โ‚ฌ200 with code FABCMTY200.

Fabric Community Sticker Design Challenge Barcelona Carousel

Fabric Community Sticker Challenge - Barcelona 2026

If you love stickers, then you will definitely want to check out our community sticker challenge, Barcelona edition!

July Power BI Update Carousel

Power BI Monthly Update - July 2026

Check out the July 2026 Power BI update to learn about new features.

Power BI DataViz World Championships carousel

Power BI DataViz World Championships - June 2026

A new Power BI DataViz World Championship is coming this June! Don't miss out on submitting your entry.

Top Solution Authors