Join us at FabCon Vienna from September 15-18, 2025
The ultimate Fabric, Power BI, SQL, and AI community-led learning event. Save €200 with code FABCOMM.
Get registered- Power BI forums
- Get Help with Power BI
- Desktop
- Service
- Report Server
- Power Query
- Mobile Apps
- Developer
- DAX Commands and Tips
- Custom Visuals Development Discussion
- Health and Life Sciences
- Power BI Spanish forums
- Translated Spanish Desktop
- Training and Consulting
- Instructor Led Training
- Dashboard in a Day for Women, by Women
- Galleries
- Data Stories Gallery
- Themes Gallery
- Contests Gallery
- Quick Measures Gallery
- Notebook Gallery
- Translytical Task Flow Gallery
- TMDL Gallery
- R Script Showcase
- Webinars and Video Gallery
- Ideas
- Custom Visuals Ideas (read-only)
- Issues
- Issues
- Events
- Upcoming Events
Enhance your career with this limited time 50% discount on Fabric and Power BI exams. Ends August 31st. Request your voucher.
- Power BI forums
- Forums
- Get Help with Power BI
- Desktop
- Re: Showing data by day without any limit
- Subscribe to RSS Feed
- Mark Topic as New
- Mark Topic as Read
- Float this Topic for Current User
- Bookmark
- Subscribe
- Printer Friendly Page
- Mark as New
- Bookmark
- Subscribe
- Mute
- Subscribe to RSS Feed
- Permalink
- Report Inappropriate Content
Showing data by day without any limit
Hello!
Hope you are doing fine 🙂
Firstly I have to tell you that I am a very begginer in Power Bi and DAX, mainly working with Visualizations applying "tricks" that I learnt from Youtube.
I am currently working on a report which shows the performance evolution of a specific department in my company. I have data since January till today and the idea is to upload the report weekly.
I want to show the evolution day by day in Line Chart. My data format is DD/MM/YYYY. When I place the Date on Axis I have the option to select the data showing by year, trimestre, month and day. The problem is that when I choose the day, somehow the chart shows me only one month (30 days aprox). I have no idea where this "grouping" is activated, I cannot see the option to disable it.
Same happens when I wanted to show data by week (in Edit Query I just created a column "Week" using formula Week of month), the chart showed me up to 5 weeks, so data from one month only.
Could anyone help me how to fix it? 🙂
Many thanks in advance,
Magus
Solved! Go to Solution.
- Mark as New
- Bookmark
- Subscribe
- Mute
- Subscribe to RSS Feed
- Permalink
- Report Inappropriate Content
hi @magus
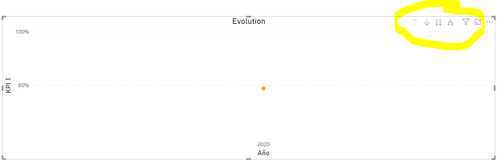
Yes, please chick "Expand all down one level in the hierarchy"
Regards,
Lin
If this post helps, then please consider Accept it as the solution to help the other members find it more quickly.
- Mark as New
- Bookmark
- Subscribe
- Mute
- Subscribe to RSS Feed
- Permalink
- Report Inappropriate Content
hi @magus
For your case, you need to use drill mode in the visual as below:
https://docs.microsoft.com/en-us/power-bi/consumer/end-user-drill
Just use expand all fields in the drill mode
Regards,
Lin
If this post helps, then please consider Accept it as the solution to help the other members find it more quickly.
- Mark as New
- Bookmark
- Subscribe
- Mute
- Subscribe to RSS Feed
- Permalink
- Report Inappropriate Content
Many thanks for your answer, nut unfortunately I can drill the data down only to the day level, and the option expand drill at once is not available 😞
Magus
- Mark as New
- Bookmark
- Subscribe
- Mute
- Subscribe to RSS Feed
- Permalink
- Report Inappropriate Content
HI @magus
Why "the option expand drill at once is not available" in your report?
and you may also try
Show items with no data in Power BI
https://docs.microsoft.com/en-us/power-bi/desktop-show-items-no-data
Regards,
Lin
If this post helps, then please consider Accept it as the solution to help the other members find it more quickly.
- Mark as New
- Bookmark
- Subscribe
- Mute
- Subscribe to RSS Feed
- Permalink
- Report Inappropriate Content
Hello CST,
The only option I see are the following:
Drill up / drill down
Go to the net level to the hierarchy
Expand all down one level in the hierarchy
- Mark as New
- Bookmark
- Subscribe
- Mute
- Subscribe to RSS Feed
- Permalink
- Report Inappropriate Content
hi @magus
Yes, please chick "Expand all down one level in the hierarchy"
Regards,
Lin
If this post helps, then please consider Accept it as the solution to help the other members find it more quickly.
- Mark as New
- Bookmark
- Subscribe
- Mute
- Subscribe to RSS Feed
- Permalink
- Report Inappropriate Content
Hello,
It worked! Thanks a lot!!
Magus
- Mark as New
- Bookmark
- Subscribe
- Mute
- Subscribe to RSS Feed
- Permalink
- Report Inappropriate Content
In the date hierarchy if you cross or drill to day level that will group at day witch can be from 1-31 only. (data will be grouped on unique axis values)
You can right-click on the date Hierarchy and choose the date option and this will show the actual date trend and you can any number or date.
- Mark as New
- Bookmark
- Subscribe
- Mute
- Subscribe to RSS Feed
- Permalink
- Report Inappropriate Content
Hello,
THank you very much for your answer.
I right clicked on Data Hierarchy but I cannot find the option of data trend. Could you guide me where I can find it?


