This is best Fabric, Power BI, SQL and AI community event. How do we know? The last event sold out! Save €200 with code FABCMTY200.
Register nowA new Data Days event is coming soon! This time we’re going bigger than ever. Fabric, Power BI, SQL, AI and more. Don't miss out.
Hello,
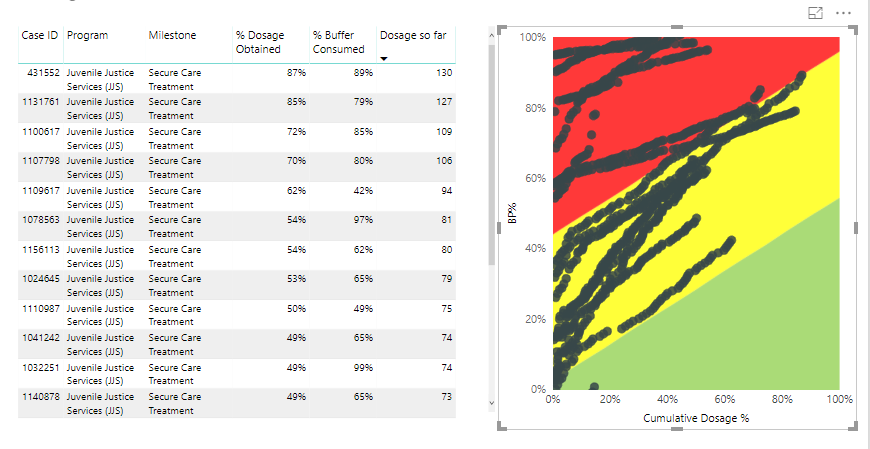
I am trying to keep my scatter, fever chart empty until something is selected on the left table. I tried using the suggestion found in the forum, to create the measure:
SlicerCheck = =if(calculate(distinctcount([SlicerColumn]),allselected([SlicerColumn]))=1,"Y","N")
but it is not working for me, I add this measure to the visual filter and set to Y and still see all the scatters in the chart. maybe I am puting the wrong [slicer Column]?? not sure..
your help is appreciated!
Solved! Go to Solution.
hi,@Allav
You can try to use ISFILTERED to add a measure like this:
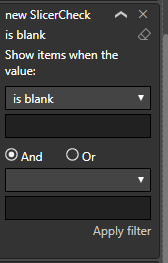
new SlicerCheck = IF(ISFILTERED(VehicleTrend[ReportDate])=BLANK() ,"Please Select a Report Date", BLANK())
and then set visual level filter:
Here is demo , please try it
Best Regards,
Lin
hi,@Allav
You can try to use ISFILTERED to add a measure like this:
new SlicerCheck = IF(ISFILTERED(VehicleTrend[ReportDate])=BLANK() ,"Please Select a Report Date", BLANK())
and then set visual level filter:
Here is demo , please try it
Best Regards,
Lin
Thanks so much, it worked!
Check out the May 2026 Power BI update to learn about new features.
Sign up to receive a private message when registration opens and key events begin.
If you have recently started exploring Fabric, we'd love to hear how it's going. Your feedback can help with product improvements.
| User | Count |
|---|---|
| 32 | |
| 25 | |
| 23 | |
| 22 | |
| 13 |
| User | Count |
|---|---|
| 62 | |
| 47 | |
| 27 | |
| 23 | |
| 19 |