Join us at the 2025 Microsoft Fabric Community Conference
Microsoft Fabric Community Conference 2025, March 31 - April 2, Las Vegas, Nevada. Use code FABINSIDER for a $400 discount.
Register now- Power BI forums
- Get Help with Power BI
- Desktop
- Service
- Report Server
- Power Query
- Mobile Apps
- Developer
- DAX Commands and Tips
- Custom Visuals Development Discussion
- Health and Life Sciences
- Power BI Spanish forums
- Translated Spanish Desktop
- Training and Consulting
- Instructor Led Training
- Dashboard in a Day for Women, by Women
- Galleries
- Webinars and Video Gallery
- Data Stories Gallery
- Themes Gallery
- Power BI DataViz World Championships Gallery
- Quick Measures Gallery
- R Script Showcase
- COVID-19 Data Stories Gallery
- Community Connections & How-To Videos
- 2021 MSBizAppsSummit Gallery
- 2020 MSBizAppsSummit Gallery
- 2019 MSBizAppsSummit Gallery
- Events
- Ideas
- Custom Visuals Ideas (read-only)
- Issues
- Issues
- Events
- Upcoming Events
The Power BI DataViz World Championships are on! With four chances to enter, you could win a spot in the LIVE Grand Finale in Las Vegas. Show off your skills.
- Power BI forums
- Forums
- Get Help with Power BI
- Desktop
- Re: Share your thoughts on the new Anomaly detecti...
- Subscribe to RSS Feed
- Mark Topic as New
- Mark Topic as Read
- Float this Topic for Current User
- Bookmark
- Subscribe
- Printer Friendly Page
- Mark as New
- Bookmark
- Subscribe
- Mute
- Subscribe to RSS Feed
- Permalink
- Report Inappropriate Content
Share your thoughts on the new Anomaly detection feature (preview)
Hit Reply to tell us what you think about the new Anomaly detection feature so we can continue to improve.
-Power BI AI team
- Mark as New
- Bookmark
- Subscribe
- Mute
- Subscribe to RSS Feed
- Permalink
- Report Inappropriate Content
Hello,
Find anomalies with custom calendar seems to give out an error. But it works with the default date hierarchy.
Would you be able to check this post here for explanation?
https://community.powerbi.com/t5/Desktop/Find-anomalies-with-custom-date-hierarchy/td-p/2123506
- Mark as New
- Bookmark
- Subscribe
- Mute
- Subscribe to RSS Feed
- Permalink
- Report Inappropriate Content
Replied.
- Mark as New
- Bookmark
- Subscribe
- Mute
- Subscribe to RSS Feed
- Permalink
- Report Inappropriate Content
Why does this feature only work when users go against best practice? Best practice being separating the model from the reporting layer.
Would be nice to get to use these cool tools when following best practices.
- Mark as New
- Bookmark
- Subscribe
- Mute
- Subscribe to RSS Feed
- Permalink
- Report Inappropriate Content
Can you elaborate what you mean the feature go against best pratice? Can you elaborate what you mean anomaly detection didn't "seperating the model from the reporting layer. "? Do you mean cannot change sensitivity at Consumer mode?
- Mark as New
- Bookmark
- Subscribe
- Mute
- Subscribe to RSS Feed
- Permalink
- Report Inappropriate Content
Hello, could you please explain the process of calculating the expected range? I have a monthly series of data which has a run-rate of about 35k, but there is one month that has 64k. The expected range for this month is 52-62k. I don't see a reason for the expected range to be so high, I would expect something like 30-40k.
Thank you.
- Mark as New
- Bookmark
- Subscribe
- Mute
- Subscribe to RSS Feed
- Permalink
- Report Inappropriate Content
Roughly, The expected value is calculated by 1) remove the anomaly points, 2) calculate an roughly average of adjacent values 2) apply frontier transform on the value from 2)
The expected range is just +/- static range based on the expected value and sensitivity.
Yet yes you are right, we are not sure why it returns the expected range > 50K not 30K-40K and we are investigating at our side, and will update the thread shortly.
Thank you for your feedback.
- Mark as New
- Bookmark
- Subscribe
- Mute
- Subscribe to RSS Feed
- Permalink
- Report Inappropriate Content
when I extend the time period of the chart (12 more months), it gives me the expected range.
- Mark as New
- Bookmark
- Subscribe
- Mute
- Subscribe to RSS Feed
- Permalink
- Report Inappropriate Content
Yeah, the anomaly detection algorithm we use is based on frequency. So if the input is small, the model cannot give a very good accuracy (well, in fact I believe it applies to all statistic models). Yet we are checking and see if we can do anything to make the result better with limited input data like what you provided above.
- Mark as New
- Bookmark
- Subscribe
- Mute
- Subscribe to RSS Feed
- Permalink
- Report Inappropriate Content
The expected min value when hovering over the line graph is impossible and showing negative numbers. The dataset we are using does not have any negatives.
- Mark as New
- Bookmark
- Subscribe
- Mute
- Subscribe to RSS Feed
- Permalink
- Report Inappropriate Content
In this case, if you could give us a repro pbix, we can try to involve Azure Anomaly Detection team to check why the negative numbers are shown.
Also, you may be interested in my reply on technical details in the same thread.
- Mark as New
- Bookmark
- Subscribe
- Mute
- Subscribe to RSS Feed
- Permalink
- Report Inappropriate Content
It seems to be software related. Asking a collegue to open the file gives explanation results, publishing the file also gives me the expected results. Weirdly enough, reinstalling did nothing for me to fix the issue.
- Mark as New
- Bookmark
- Subscribe
- Mute
- Subscribe to RSS Feed
- Permalink
- Report Inappropriate Content
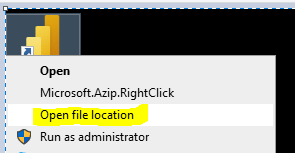
What about re-install in a different folder? Or after un-install, and try delete the existing PBI Desktop folder (you can get it via right click on the PBIDesktop icon).
Make sure you get the latest Desktop version.
Hope a clean re-install can fix the issue.
If still have issue, we probably need to check .Net version. https://docs.microsoft.com/en-us/dotnet/framework/migration-guide/how-to-determine-which-versions-ar...
- Mark as New
- Bookmark
- Subscribe
- Mute
- Subscribe to RSS Feed
- Permalink
- Report Inappropriate Content
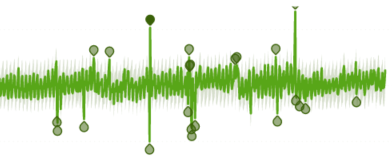
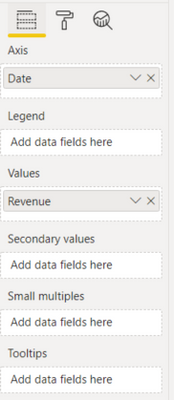
Everything is working for me, until I click on an anomaly:
Its a blank report with just date in the axis and revenue in the values.
This is without adding anything special to the overview. I tried it with 3 different reports that had different datasets, all with the same results. What am I doing wrong?
Version: 2.88.621.0 64-bit
- Mark as New
- Bookmark
- Subscribe
- Mute
- Subscribe to RSS Feed
- Permalink
- Report Inappropriate Content
I have the same problem when in Desktop mode, but it works when I publish to https://app.powerbi.com/.
Does it work for you when you publish?
If so, why doesn't work in desktop mode?
- Mark as New
- Bookmark
- Subscribe
- Mute
- Subscribe to RSS Feed
- Permalink
- Report Inappropriate Content
Is it feasible to share a repro to us?
- Mark as New
- Bookmark
- Subscribe
- Mute
- Subscribe to RSS Feed
- Permalink
- Report Inappropriate Content
Hi to everyone,
I found some exemples on internet to test anomaly detenction.
I send you the link of one:
https://radacad.com/anomaly-detection-in-power-bi
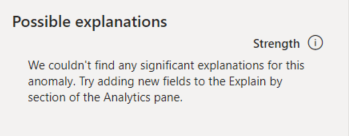
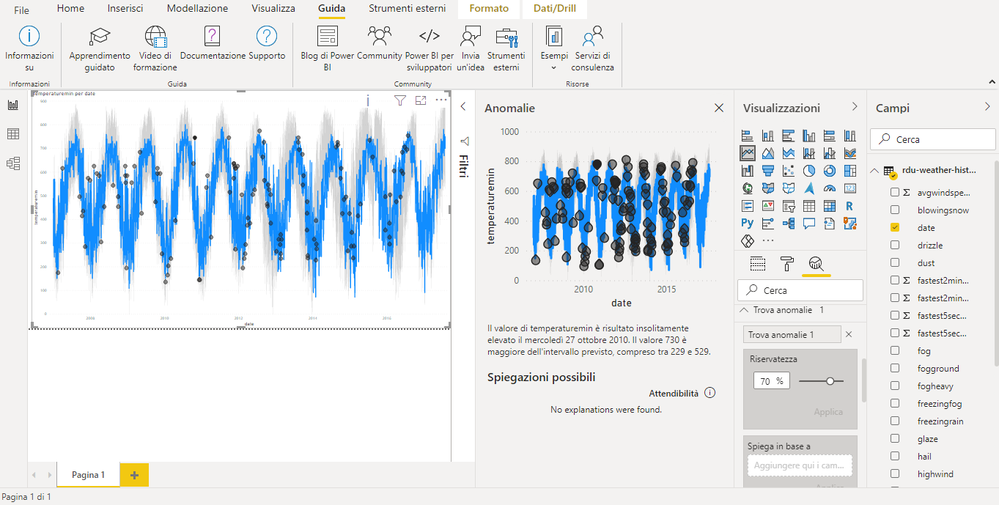
I followed every step but the explaination panel alweys show me the same message:
"No explainations were found"
I send you the pbix that I used
https://1drv.ms/u/s!Aq9vs57jlUsQgxc3QKRh8CyXhaPJ
Can you tell me what's wrong?
- Mark as New
- Bookmark
- Subscribe
- Mute
- Subscribe to RSS Feed
- Permalink
- Report Inappropriate Content
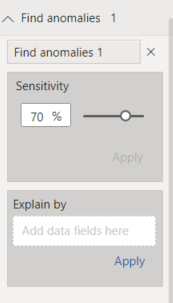
Hello @I365SvcUsr , I see from your pbix that you are trying to explain by just two fields. If you remove these fields from the explain by field well, our automatic field selection will kick in and allow you to find explanations on more points. You can also try dragging more fields to the explain by field well.
Additionally, it is expected that some anomaly points won't return explanations, because there simply isn't enough information to explain that point with confidence.
- Mark as New
- Bookmark
- Subscribe
- Mute
- Subscribe to RSS Feed
- Permalink
- Report Inappropriate Content
Hi,
i tried to remove all values from the "explain by" field but nothing changes: the explanation panel is always empty.
I also selected the same date of the example that I sent you (27 october 2010).
Can you show me what you see selecting this date into the pbix that i sent you?
- Mark as New
- Bookmark
- Subscribe
- Mute
- Subscribe to RSS Feed
- Permalink
- Report Inappropriate Content
Hello,
I did see that some edits were made to the data in this pbix so that it no longer matches the data given in the tutorial you linked, so some results may be different. However, I get quite a few explanations returned in the pbix you sent when I click on the anomaly point at 27 October, 2010 and have no fields in the explain by field well.
Can you try closing the pane, removing the anomaly detection card, and applying anomaly detection again? Then check if you can get explanations for this point.
If not, can you create a new pbix using the data directly from the tutorial at https://radacad.com/anomaly-detection-in-power-bi and try again? That way we can check if you are able to get explanations results at all.
- Mark as New
- Bookmark
- Subscribe
- Mute
- Subscribe to RSS Feed
- Permalink
- Report Inappropriate Content
Hello,
I wanna explain you every step I did this second time:
I uninstalled and installed PBI Dextop. After that, I downloaded again the .CSV from the linked tutorial and I imported it into a new pbix. I checked the option "Anomaly detenction" so I closed and opened the pbix.
At this time, I clicked on the line chart in the visualization panel and select thedate for Axis and temperature into Values, so I applied anomaly detection without fields in the explain by field.
The result is the same:
https://1drv.ms/u/s!Aq9vs57jlUsQgxhyFhRlDFHpDGBs
Nothing appears..
Helpful resources

Join us at the Microsoft Fabric Community Conference
March 31 - April 2, 2025, in Las Vegas, Nevada. Use code MSCUST for a $150 discount!

Power BI Monthly Update - February 2025
Check out the February 2025 Power BI update to learn about new features.

| User | Count |
|---|---|
| 86 | |
| 81 | |
| 53 | |
| 37 | |
| 37 |


