FabCon is coming to Atlanta
Join us at FabCon Atlanta from March 16 - 20, 2026, for the ultimate Fabric, Power BI, AI and SQL community-led event. Save $200 with code FABCOMM.
Register now!- Power BI forums
- Get Help with Power BI
- Desktop
- Service
- Report Server
- Power Query
- Mobile Apps
- Developer
- DAX Commands and Tips
- Custom Visuals Development Discussion
- Health and Life Sciences
- Power BI Spanish forums
- Translated Spanish Desktop
- Training and Consulting
- Instructor Led Training
- Dashboard in a Day for Women, by Women
- Galleries
- Data Stories Gallery
- Themes Gallery
- Contests Gallery
- QuickViz Gallery
- Quick Measures Gallery
- Visual Calculations Gallery
- Notebook Gallery
- Translytical Task Flow Gallery
- TMDL Gallery
- R Script Showcase
- Webinars and Video Gallery
- Ideas
- Custom Visuals Ideas (read-only)
- Issues
- Issues
- Events
- Upcoming Events
The Power BI Data Visualization World Championships is back! It's time to submit your entry. Live now!
- Power BI forums
- Forums
- Get Help with Power BI
- Desktop
- Re: Scatter plot
- Subscribe to RSS Feed
- Mark Topic as New
- Mark Topic as Read
- Float this Topic for Current User
- Bookmark
- Subscribe
- Printer Friendly Page
- Mark as New
- Bookmark
- Subscribe
- Mute
- Subscribe to RSS Feed
- Permalink
- Report Inappropriate Content
Scatter plot
Hello,
I would like to do a scatter plot in power bi, but I don't find the good way to do it.
I have two colums: one column parameter with lot of diferent parametes, and one column value like this example of tab below :
And I would like to do a scatter plot by selecting two parameters from the column parameter that could be diferent from Calcium and phosphorus if for example, I would also want to look at Magnesium and sodium together:
Do you know if there is a way to do it in power bi ?
Thank you!
Solved! Go to Solution.
- Mark as New
- Bookmark
- Subscribe
- Mute
- Subscribe to RSS Feed
- Permalink
- Report Inappropriate Content
@matdel I have created these two tables manually. But they can be created automatically like below. make sure there is no relationship between these tables.

Did I answer your question? Mark my post as a solution!
Appreciate your Kudos
Proud to be a Super User!
Follow me on linkedin
- Mark as New
- Bookmark
- Subscribe
- Mute
- Subscribe to RSS Feed
- Permalink
- Report Inappropriate Content
another question, how have you created the two tables para_tab ? Are they automatical or did you create them manually ?
thnaks!
- Mark as New
- Bookmark
- Subscribe
- Mute
- Subscribe to RSS Feed
- Permalink
- Report Inappropriate Content
@matdel I have created these two tables manually. But they can be created automatically like below. make sure there is no relationship between these tables.

Did I answer your question? Mark my post as a solution!
Appreciate your Kudos
Proud to be a Super User!
Follow me on linkedin
- Mark as New
- Bookmark
- Subscribe
- Mute
- Subscribe to RSS Feed
- Permalink
- Report Inappropriate Content
Thank you!! it works well 🙂
- Mark as New
- Bookmark
- Subscribe
- Mute
- Subscribe to RSS Feed
- Permalink
- Report Inappropriate Content
pl. create two measures

let me know if you are looking for something else. pbix file attached below
Did I answer your question? Mark my post as a solution!
Appreciate your Kudos
Proud to be a Super User!
Follow me on linkedin
- Mark as New
- Bookmark
- Subscribe
- Mute
- Subscribe to RSS Feed
- Permalink
- Report Inappropriate Content
Hello, yes this solution works if I use only those two parameters. But my problematic comes from that those two parameters are variable. I would like to change them and not necessary use calcium and phosphorus.
In the column parameter, I have also others like : magnesium, sodium, Iron,... and I would like to be able to change easily the parameters used in the graphics
- Mark as New
- Bookmark
- Subscribe
- Mute
- Subscribe to RSS Feed
- Permalink
- Report Inappropriate Content
- Mark as New
- Bookmark
- Subscribe
- Mute
- Subscribe to RSS Feed
- Permalink
- Report Inappropriate Content
Ok great!! I will try thank you so much!
- Mark as New
- Bookmark
- Subscribe
- Mute
- Subscribe to RSS Feed
- Permalink
- Report Inappropriate Content
@matdel , you have only two columns. Value of both X and Y-axis
parameter as legend and index column as details
https://stackoverflow.com/questions/45715963/creating-an-index-column-for-power-bi
- Mark as New
- Bookmark
- Subscribe
- Mute
- Subscribe to RSS Feed
- Permalink
- Report Inappropriate Content
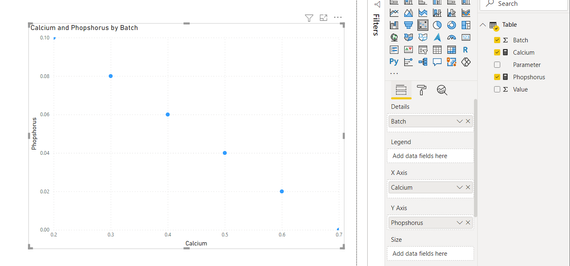
hello, yes i forgot that I have also a column Batch number
But it doesn't work, even when I put Batch number in details.
I would like to have the values of the calcium on the X axis and the value of the phosphurus on the Y axis.
Helpful resources
| User | Count |
|---|---|
| 50 | |
| 42 | |
| 36 | |
| 31 | |
| 28 |
| User | Count |
|---|---|
| 139 | |
| 128 | |
| 60 | |
| 59 | |
| 57 |


