FabCon is coming to Atlanta
Join us at FabCon Atlanta from March 16 - 20, 2026, for the ultimate Fabric, Power BI, AI and SQL community-led event. Save $200 with code FABCOMM.
Register now!- Power BI forums
- Get Help with Power BI
- Desktop
- Service
- Report Server
- Power Query
- Mobile Apps
- Developer
- DAX Commands and Tips
- Custom Visuals Development Discussion
- Health and Life Sciences
- Power BI Spanish forums
- Translated Spanish Desktop
- Training and Consulting
- Instructor Led Training
- Dashboard in a Day for Women, by Women
- Galleries
- Data Stories Gallery
- Themes Gallery
- Contests Gallery
- QuickViz Gallery
- Quick Measures Gallery
- Visual Calculations Gallery
- Notebook Gallery
- Translytical Task Flow Gallery
- TMDL Gallery
- R Script Showcase
- Webinars and Video Gallery
- Ideas
- Custom Visuals Ideas (read-only)
- Issues
- Issues
- Events
- Upcoming Events
Get Fabric Certified for FREE during Fabric Data Days. Don't miss your chance! Request now
- Power BI forums
- Forums
- Get Help with Power BI
- Desktop
- Re: SUM with hierarchy
- Subscribe to RSS Feed
- Mark Topic as New
- Mark Topic as Read
- Float this Topic for Current User
- Bookmark
- Subscribe
- Printer Friendly Page
- Mark as New
- Bookmark
- Subscribe
- Mute
- Subscribe to RSS Feed
- Permalink
- Report Inappropriate Content
SUM with hierarchy
Hi, I've done a mesure to filter data from a date-hour to a date-hour but I'm having problems with the hierarchy of day-bin of hours-hour. Could you help me please?
As you can see, my table shows the expected result and if I plot it in a lineal graphic (top-right graphic) it works fine, the problem is that I want to show it in a hierarchy:
- Date (DD/MM/YYYY)
- Hour (in bins of 30 minutes)
- Hour (exactly)
When I try to do this (graphic of top-right corner), I don't have data for 20/11/2017 and 24/11/2017 navegating in the top of the hierarchy, If i drill down to the Hour (bin) hierarchy, I've my data.
Could you help me please?
- Mark as New
- Bookmark
- Subscribe
- Mute
- Subscribe to RSS Feed
- Permalink
- Report Inappropriate Content
I'm not sure I understand what you're asking exactly. What is the result that you want? What would it look like?
- Mark as New
- Bookmark
- Subscribe
- Mute
- Subscribe to RSS Feed
- Permalink
- Report Inappropriate Content
Sorry, I'll try it again. As you can see in the image below:
I've values of CLIENTES for a DATE-TIME Period, with "Prueba 2" measure I'm filtering by day and hour, so if I'm filtering from 20/11/2017 at 21:00 I've some filtered registers to "Prueba 2" but they are not appearing in my chart graphic. I've just values to 21-23 / 11 / 2017, so, do you have any idea abour what's happening?
- Mark as New
- Bookmark
- Subscribe
- Mute
- Subscribe to RSS Feed
- Permalink
- Report Inappropriate Content
@Anonymous
Could you please share the workspace with us so as to have a look at it?
Mask any sensitive data
- Mark as New
- Bookmark
- Subscribe
- Mute
- Subscribe to RSS Feed
- Permalink
- Report Inappropriate Content
- Mark as New
- Bookmark
- Subscribe
- Mute
- Subscribe to RSS Feed
- Permalink
- Report Inappropriate Content
@Anonymous
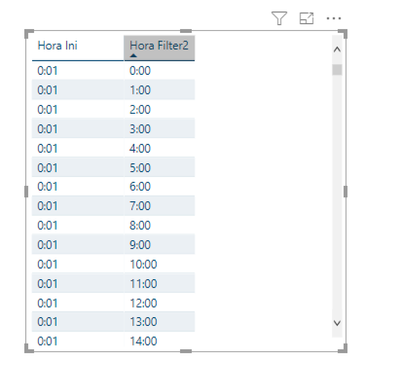
It seems that your Hora Filter2 formula is wrong.
When i put Hora Ini next to HoraFilter 2 it shows the following:
And this happens because your tables are linked on Date field and not a DateTime field so the time gets messed up
Helpful resources

Power BI Monthly Update - November 2025
Check out the November 2025 Power BI update to learn about new features.

Fabric Data Days
Advance your Data & AI career with 50 days of live learning, contests, hands-on challenges, study groups & certifications and more!

| User | Count |
|---|---|
| 103 | |
| 80 | |
| 62 | |
| 50 | |
| 45 |


