FabCon is coming to Atlanta
Join us at FabCon Atlanta from March 16 - 20, 2026, for the ultimate Fabric, Power BI, AI and SQL community-led event. Save $200 with code FABCOMM.
Register now!- Power BI forums
- Get Help with Power BI
- Desktop
- Service
- Report Server
- Power Query
- Mobile Apps
- Developer
- DAX Commands and Tips
- Custom Visuals Development Discussion
- Health and Life Sciences
- Power BI Spanish forums
- Translated Spanish Desktop
- Training and Consulting
- Instructor Led Training
- Dashboard in a Day for Women, by Women
- Galleries
- Data Stories Gallery
- Themes Gallery
- Contests Gallery
- Quick Measures Gallery
- Notebook Gallery
- Translytical Task Flow Gallery
- TMDL Gallery
- R Script Showcase
- Webinars and Video Gallery
- Ideas
- Custom Visuals Ideas (read-only)
- Issues
- Issues
- Events
- Upcoming Events
To celebrate FabCon Vienna, we are offering 50% off select exams. Ends October 3rd. Request your discount now.
- Power BI forums
- Forums
- Get Help with Power BI
- Desktop
- Re: SSAS MD cube measures not displaying as Power ...
- Subscribe to RSS Feed
- Mark Topic as New
- Mark Topic as Read
- Float this Topic for Current User
- Bookmark
- Subscribe
- Printer Friendly Page
- Mark as New
- Bookmark
- Subscribe
- Mute
- Subscribe to RSS Feed
- Permalink
- Report Inappropriate Content
SSAS MD cube measures not displaying as Power BI measure format
Hi Everyone,
In SSAS measures are showing like this
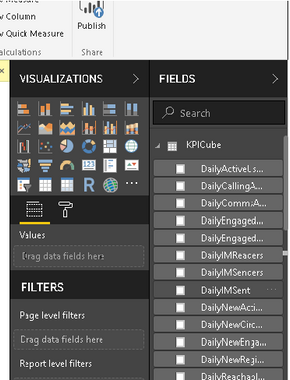
When i import measures in cube,its showing in tabular Format not as Power BI measures.
Please help me on this,why iit not showing as power bi measure
Solved! Go to Solution.
- Mark as New
- Bookmark
- Subscribe
- Mute
- Subscribe to RSS Feed
- Permalink
- Report Inappropriate Content
Hi @atul9063,
Please pay attention to the difference when importing measures from SSAS Mutidimensional cube into Power BI desktop with different ways.
Live connection to SSAS which loads the whole cube into desktop. This way, measures are formated as measures in Power BI.
Connect to SSAS with import mode. Import measures only. This scenario is similar to yours where SSAS measures are recognized as a normal field in Power BI desktop.
Connect to SSAS with import mode. Import measures and its related table/columns. As mentioned in this document, Measure groups in a multidimensional cube are exposed in Power BI as tables with the ∑ sign beside them in the Fields pane.
Best regards,
Yuliana Gu
If this post helps, then please consider Accept it as the solution to help the other members find it more quickly.
- Mark as New
- Bookmark
- Subscribe
- Mute
- Subscribe to RSS Feed
- Permalink
- Report Inappropriate Content


