FabCon is coming to Atlanta
Join us at FabCon Atlanta from March 16 - 20, 2026, for the ultimate Fabric, Power BI, AI and SQL community-led event. Save $200 with code FABCOMM.
Register now!- Power BI forums
- Get Help with Power BI
- Desktop
- Service
- Report Server
- Power Query
- Mobile Apps
- Developer
- DAX Commands and Tips
- Custom Visuals Development Discussion
- Health and Life Sciences
- Power BI Spanish forums
- Translated Spanish Desktop
- Training and Consulting
- Instructor Led Training
- Dashboard in a Day for Women, by Women
- Galleries
- Data Stories Gallery
- Themes Gallery
- Contests Gallery
- Quick Measures Gallery
- Notebook Gallery
- Translytical Task Flow Gallery
- TMDL Gallery
- R Script Showcase
- Webinars and Video Gallery
- Ideas
- Custom Visuals Ideas (read-only)
- Issues
- Issues
- Events
- Upcoming Events
To celebrate FabCon Vienna, we are offering 50% off select exams. Ends October 3rd. Request your discount now.
- Power BI forums
- Forums
- Get Help with Power BI
- Desktop
- Re: Running total for 'row count'
- Subscribe to RSS Feed
- Mark Topic as New
- Mark Topic as Read
- Float this Topic for Current User
- Bookmark
- Subscribe
- Printer Friendly Page
- Mark as New
- Bookmark
- Subscribe
- Mute
- Subscribe to RSS Feed
- Permalink
- Report Inappropriate Content
Running total for 'row count'
Hi,
I'm looking for a variant of the often mentioned running total calculation.
My data does not contain the numbers to add up in the running total, like most Sales data examples around.
My data IS the number to add up, each row being a ticket at a Service Desk.
I would like to know the running total for tickets created and/or closed, by Date:
| Source data | ||
| Nr | Creation | Closure |
| INC0001 | 1/01/2019 | 1/05/2019 |
| INC0002 | 1/01/2019 | 1/06/2019 |
| INC0003 | 1/02/2019 | 1/06/2019 |
| REQ0001 | 1/01/2019 | 1/07/2019 |
| REQ0002 | 1/02/2019 | 1/07/2019 |
| REQ0003 | 1/02/2019 | 1/08/2019 |
Filtering 'INC*' from 'REQ*' can be done on a visual level, so I don't think that needs to be in the code(?)
So I would like to end up with these results (not necessarily combined in 1 measure/visual/...):
| Incidents opened | Incidents closed | |||
| 01/2019 | 2 | 05/2019 | 1 | |
| 02/2019 | 3 | 06/2019 | 3 | |
| Requests opened | Requests closed | |||
| 01/2019 | 1 | 07/2019 | 2 | |
| 02/2019 | 3 | 08/2019 | 3 |
Thanks for the help!
Solved! Go to Solution.
- Mark as New
- Bookmark
- Subscribe
- Mute
- Subscribe to RSS Feed
- Permalink
- Report Inappropriate Content
Hi @BartVanH,
You could refer to modifying your formula as below:
Measure running total in value =
SUMX(FILTER(ALLEXCEPT(Table1,Table1[Attribute],Table1[Legend],Table1[Nr]),'Table1'[Value]<=MAX('Table1'[Value])),[Measure])
Result:
Regards,
Daniel He
If this post helps, then please consider Accept it as the solution to help the other members find it more quickly.
- Mark as New
- Bookmark
- Subscribe
- Mute
- Subscribe to RSS Feed
- Permalink
- Report Inappropriate Content
Hi @BartVanH,
Based on my test, you could refer to below steps:
Unpivot your Creation and Closure column in query editor:
Result:
Apply it and create below measures:
Measure = CALCULATE(COUNT(Table1[Value]))
Measure running total in value =
SUMX(FILTER(ALLSELECTED(Table1[Value]),'Table1'[Value]<=MAX('Table1'[Value])),[Measure])
Result:
You could also download the pbix file to have a view.
Regards,
Daniel He
If this post helps, then please consider Accept it as the solution to help the other members find it more quickly.
- Mark as New
- Bookmark
- Subscribe
- Mute
- Subscribe to RSS Feed
- Permalink
- Report Inappropriate Content
Hi @v-danhe-msft,
Thanks a lot!
The calculation seems to work perfectly!
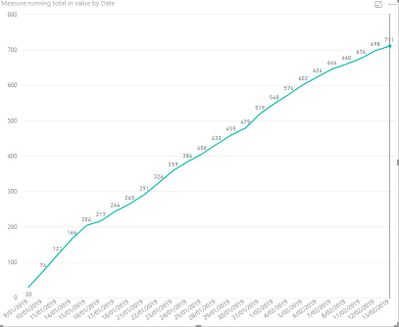
Here it is in a line graph:
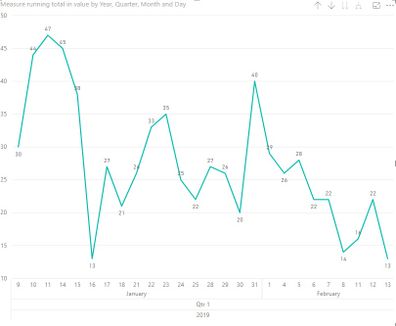
However, when I select the Date Hierarchy in the field well:
It all reverts back to the individual values once I start drilling down...
I have a feeling I know why it's doing that, but is there any way around?
The first version is not my favorite, it's not the most aesthetic way to display the data.
But if there is no way around, I'll use that.
Thanks again!
Bart
- Mark as New
- Bookmark
- Subscribe
- Mute
- Subscribe to RSS Feed
- Permalink
- Report Inappropriate Content
Hi @BartVanH,
You could refer to modifying your formula as below:
Measure running total in value =
SUMX(FILTER(ALLEXCEPT(Table1,Table1[Attribute],Table1[Legend],Table1[Nr]),'Table1'[Value]<=MAX('Table1'[Value])),[Measure])
Result:
Regards,
Daniel He
If this post helps, then please consider Accept it as the solution to help the other members find it more quickly.
- Mark as New
- Bookmark
- Subscribe
- Mute
- Subscribe to RSS Feed
- Permalink
- Report Inappropriate Content
Beautiful, thanks!


