This time we’re going bigger than ever. Fabric, Power BI, SQL, AI and more. We're covering it all. You won't want to miss it.
Learn moreLevel up your Power BI skills this month - build one visual each week and tell better stories with data! Get started
Hello,
I was trying to calculate YTD running total with few different approaches:
1) YTDCalculate = CALCULATE( SUM( Repairs[Repairs]), FILTER ( ALL ( 'Calendar'[Date] ), 'Calendar'[Date] <= MAX ( Repairs[Date] )))
2) YTDCalculate2 = IF ( MIN ( 'Calendar'[Date] ) <= CALCULATE ( MAX (Repairs[Date]), ALL ( Repairs ) ), CALCULATE ( SUM ( Repairs[Repairs] ), FILTER ( ALL ( 'Calendar'[Date] ), 'Calendar'[Date] <= MAX ( 'Calendar'[Date] ) ) ) )
3) YTDtotalYTD = TOTALYTD(sum(Repairs[Repairs]),'Calendar'[Date])
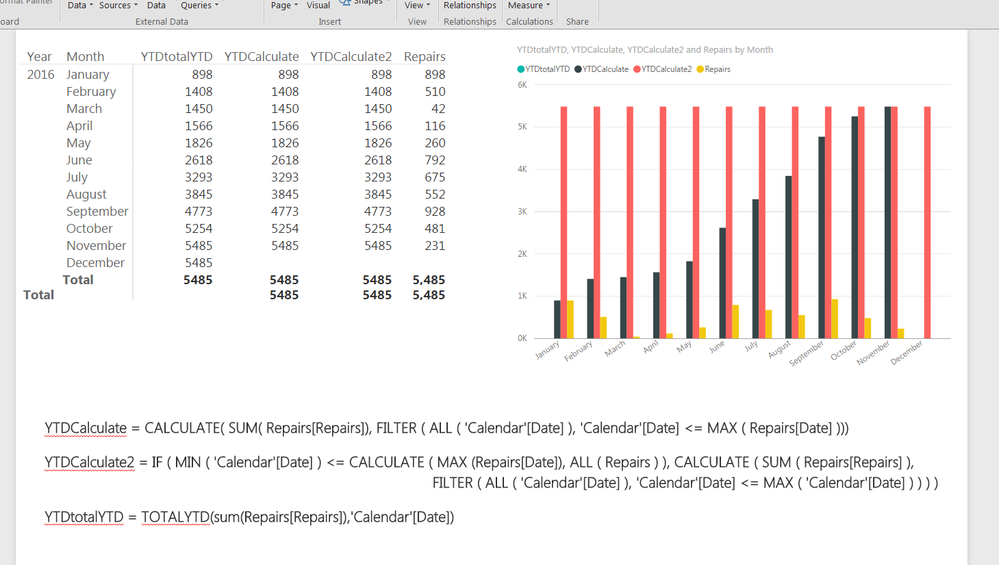
All of them provide correct expected output if I display them in table form, but if I try to make a line/bar chart it became very confusing:
1) YTDCalculate - works fine, as needed
2) YTDCalculate2 - for some reason only totals shown
3) YTDtotalYTD - ignored, not recognised by line/bar charts
Could somebody please clarify on this? Why the behaviour of these calculations are different in table and line/bar chart?
Why TOTALYTD is not recognised in line/bar chart?
If any of these formulas needs improvement - your help would be very appreciated.
Here is the screenshot:
Thanks a lot in advance!
Best regards,
Sasha
Solved! Go to Solution.
Hi @Anonymous,
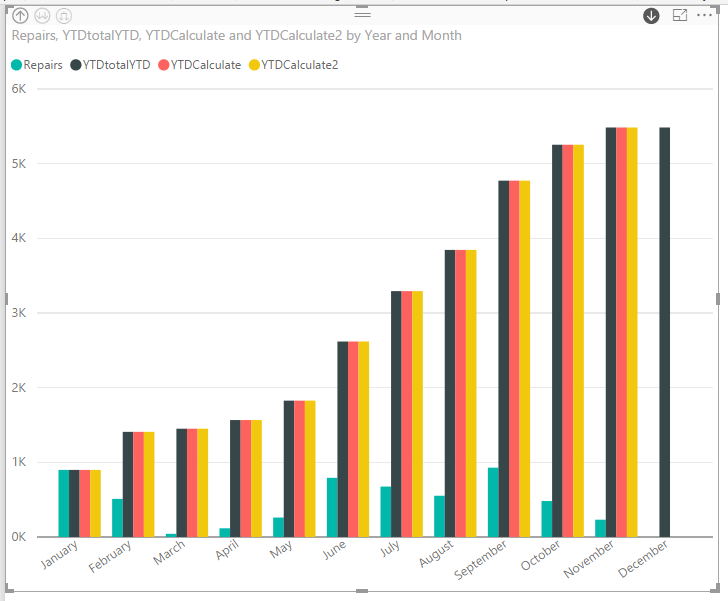
After looking into the shared pbix file and doing a few tests on it, I find that all the three measures can work correctly if we don't select the double arrow directly, and enable drill down first by selecting the arrow icon in the top right corner of the chart, then click on the data column on the chart to select a year to drill down.
All the three measures work correctly like below.
If we simply select the double arrow, only the first measure works fine. That's because the measures will be evaluated under context of each month of all the years(2015-2018) in this scenario, as we didn't select a specific Year to drill down. So only the first measure works fine.
Regards
Hi @Anonymous,
After looking into the shared pbix file and doing a few tests on it, I find that all the three measures can work correctly if we don't select the double arrow directly, and enable drill down first by selecting the arrow icon in the top right corner of the chart, then click on the data column on the chart to select a year to drill down.
All the three measures work correctly like below.
If we simply select the double arrow, only the first measure works fine. That's because the measures will be evaluated under context of each month of all the years(2015-2018) in this scenario, as we didn't select a specific Year to drill down. So only the first measure works fine.
Regards
Here is the file with this measures:
https://1drv.ms/u/s!Al5wGdutBKRWgn3p2GvYlaZNA6qv
Any help is appreciated.
Thanks!
Check out the April 2026 Power BI update to learn about new features.
Sign up to receive a private message when registration opens and key events begin.
If you have recently started exploring Fabric, we'd love to hear how it's going. Your feedback can help with product improvements.
| User | Count |
|---|---|
| 35 | |
| 33 | |
| 26 | |
| 22 | |
| 18 |
| User | Count |
|---|---|
| 66 | |
| 36 | |
| 32 | |
| 26 | |
| 23 |