Join us at FabCon Vienna from September 15-18, 2025
The ultimate Fabric, Power BI, SQL, and AI community-led learning event. Save €200 with code FABCOMM.
Get registered- Power BI forums
- Get Help with Power BI
- Desktop
- Service
- Report Server
- Power Query
- Mobile Apps
- Developer
- DAX Commands and Tips
- Custom Visuals Development Discussion
- Health and Life Sciences
- Power BI Spanish forums
- Translated Spanish Desktop
- Training and Consulting
- Instructor Led Training
- Dashboard in a Day for Women, by Women
- Galleries
- Data Stories Gallery
- Themes Gallery
- Contests Gallery
- Quick Measures Gallery
- Notebook Gallery
- Translytical Task Flow Gallery
- TMDL Gallery
- R Script Showcase
- Webinars and Video Gallery
- Ideas
- Custom Visuals Ideas (read-only)
- Issues
- Issues
- Events
- Upcoming Events
Enhance your career with this limited time 50% discount on Fabric and Power BI exams. Ends September 15. Request your voucher.
- Power BI forums
- Forums
- Get Help with Power BI
- Desktop
- Re: Row count at each step in Query (Power BI Desk...
- Subscribe to RSS Feed
- Mark Topic as New
- Mark Topic as Read
- Float this Topic for Current User
- Bookmark
- Subscribe
- Printer Friendly Page
- Mark as New
- Bookmark
- Subscribe
- Mute
- Subscribe to RSS Feed
- Permalink
- Report Inappropriate Content
Row count at each step in Query (Power BI Desktop)
Hello,
I'm building a query based on large excel files.
When there are more than 999 rows I see an information like "30 COLUMNS, 999+ ROWS" after each step in my Query.
Imagine, that my query has about 50 steps, merging multiple tables.
How can I check the total rows count at each step of query ? This is the only way for me to verify that the merging didn't duplicate rows.
Adding separate column for indexing sounds a little silly because I'd still have to sort the list descending to see the largest index etc. I can't imagine doing that at each step to verify my calculations. It should be simply-accessible information - honestly - it's one of the most important information when working with databases IMO.
Is there a way I can get that information at each step of my query ?
Regards.
Darek
Solved! Go to Solution.
- Mark as New
- Bookmark
- Subscribe
- Mute
- Subscribe to RSS Feed
- Permalink
- Report Inappropriate Content
An aternative workaround would be to create your query and next, in the Advanced Editor, add some row count steps after steps you want to verify.
My guess is that there would be a limited number of steps that could possibly influence the number of rows in your table, so you don't need to do it after each query step.
You can (de)comment the row count steps as required.
C0010 = Table.RowCount(PreviousStep),
You may also want to check again when you refresh your data: maybe rows won't be added with the current snapshot, but they might be with future data.
- Mark as New
- Bookmark
- Subscribe
- Mute
- Subscribe to RSS Feed
- Permalink
- Report Inappropriate Content
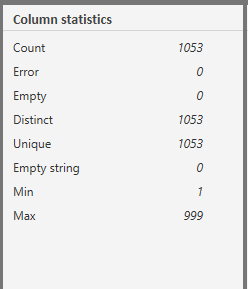
Just to add to this, you can turn on "Column profile" under "View" in the Query Editor. This gives a count of values in any particular column. (As long as you have "Column profiling based on entire dataset" turned on)
Bit quicker than adding a new custom column.
- Mark as New
- Bookmark
- Subscribe
- Mute
- Subscribe to RSS Feed
- Permalink
- Report Inappropriate Content
This is a great advice! Just to add clarity:
"To change the profiling so it analyses the entire column of data, select the profiling status in the status bar. Then select Column profiling based on the entire data set." (source)
- Mark as New
- Bookmark
- Subscribe
- Mute
- Subscribe to RSS Feed
- Permalink
- Report Inappropriate Content
For future readers, just to crank this up a notch, let's say you have a 100-step query with 40 merges (I know, right!), and you just want to see your row counts change over the entire thing without too much effort. Well then, give this a whizz:
-1- Duplicate your query
-2- Open Advanced Editor on your copy and change the 'let' to '[', and your 'in lastStep' to ']'. So:
let
    Source = mySource,
    someStuff = doTransformMagic
in
    someStuff

...goes to:

[
    Source = mySource,
    someStuff = doTransformMagic
]
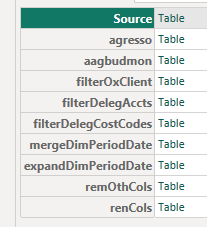
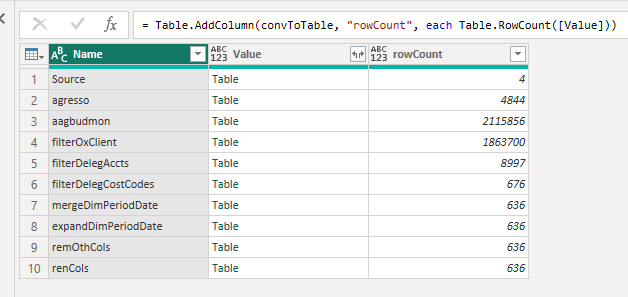
This will convert your query into a record, with each step being its own row, something like this:
-3- Convert your record into a table and add a custom column that is just = Table.RowCount([Value])
Et Voila:
Then, to update later when new steps are added, you can just copy your current query between let and in, and paste it into your copy between [ and ].
Pete
Now accepting Kudos! If my post helped you, why not give it a thumbs-up?
Proud to be a Datanaut!
- Mark as New
- Bookmark
- Subscribe
- Mute
- Subscribe to RSS Feed
- Permalink
- Report Inappropriate Content
I think you can load more or at the end of each query oad the data into the model and see the output in there.
It displays as 999+ because it is only showing a small number of the values so that you can see how the change in the query alters the data. I think the only way round this is loading all of the data in after each step and making a note of the rows manually.
- Mark as New
- Bookmark
- Subscribe
- Mute
- Subscribe to RSS Feed
- Permalink
- Report Inappropriate Content
Do you think this is an optimal solution in any way ?
Also, what do you mean by saying
@Back2Basics wrote:I think the only way round this is loading all of the data in after each step and making a note of the rows manually.
??
If my query has 50 steps and I want to make sure that after step 15 (merging) I still have the same number of rows (let's imagine this is expected) - I can't imagine removing all steps back to step 15 to load it fully into the model ?
If I'd want to confirm the same thing in other steps (let's say 20, 30, 40) - that would be a terrible way to ensure how many rows I have.
Perhaps there is some space in Query for additional function:
I can imagine that it shows 999+ when there are more than 999 rows, but when I click "999+" it would calculate exact number.
Regards,
Darek
- Mark as New
- Bookmark
- Subscribe
- Mute
- Subscribe to RSS Feed
- Permalink
- Report Inappropriate Content
Hi @dariuszszyc,
I think this is good for performance. If all the tables of a very large dataset were imported to the Query Editor, that would be very slow. There are two workarounds here we can get the total rows of a table. Please have a try.
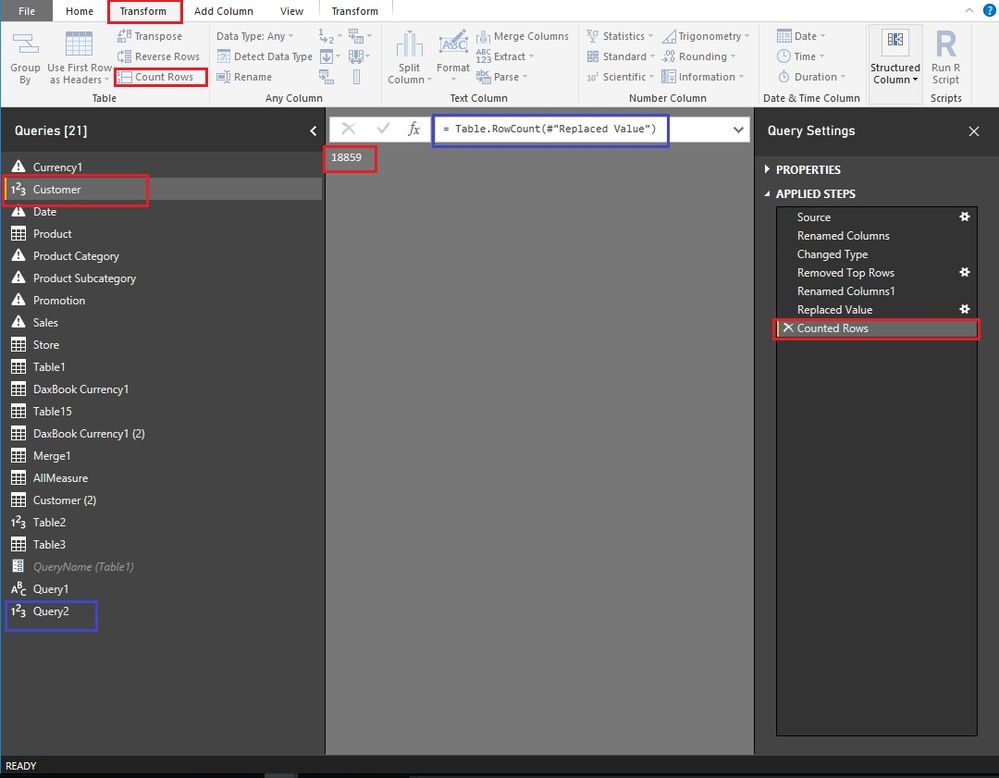
- Use function “Count Rows” (Red rectangle in the picture). There is a disadvantage that we have to delete this step later. (We could insert a step and then delete it to satisfy your latest post.)
- Create a new table to show the total rows of special table. Every time we click this table, it will show us the total rows of the latest status of the special table. (Blue rectangle in the picture)
New Source -> Other -> Blank Query -> Input “= Table.RowCount(#"Customer")”
Best Regards!
Dale
If this post helps, then please consider Accept it as the solution to help the other members find it more quickly.
- Mark as New
- Bookmark
- Subscribe
- Mute
- Subscribe to RSS Feed
- Permalink
- Report Inappropriate Content
@dariuszszyc, @MarcelBeug here's an alternative method that I think gets to what you're asking for - record/row count instride with your ETL processes. I'd like to see that as well, but this is how I approached it:
See Code:
At Line(s) (4/5, 11/12, 19/20, & 29/30) - you'll see the #"Intermediate Row Count" = Table.RowCount(PreviousStep)
At Line(s) (6/7, 13/14/15, 21/22/23, & 31/32) - you'll see that I continue my ETL process by referencing the step prior to the 'Table.RowCount()' function.
Line1: let
Line2:     // BL: Assets with Vulnerabilities
Line3:     Source = fact_asset_vulnerability_instance,
Line4:     // Get row/record count. (32000 rows)
Line5:     #"Intermediate Row Count1" = Table.RowCount(Source),
Line6:     // Continue ETL from previous relevant step (before row count)
Line7:     #"Sorted Rows1" = Table.Sort(Source,{{"vulnerability_id", Order.Ascending},{"asset_id", Order.Ascending}}),
Line8:     // Joins 'Assets w/ Vulnerabilties' to 'Vulnerabilities w/ Solutions' IOT align the Solution(s) with the Asset(s).
Line9:     #"Merged Queries" = Table.NestedJoin(#"Sorted Rows1", {"vulnerability_id"}, Vulnerability_Solution_Crosswalk, {"vulnerability_id"}, "Vulnerability_Solution_Crosswalk", JoinKind.LeftOuter),
Line10:     #"Expanded Vulnerability_Solution_Crosswalk" = Table.ExpandTableColumn(#"Merged Queries", "Vulnerability_Solution_Crosswalk", {"solution_id", "exploit", "malware_kit", "cvss_v3_score"}, {"Vulnerability.solution_id", "Vulnerability.exploit", "Vulnerability.malware_kit", "Vulnerability.cvss_v3_score"}),
Line11:    // Get row/record count. (32000 rows)
Line12:    #"Intermediate Row Count2" = Table.RowCount(#"Expanded Vulnerability_Solution_Crosswalk"),
Line13:    // Continue ETL from previous relevant step (before row count)
Line14:    // Groups by Date and ID to aggregate counts
Line15:    #"Grouped Rows" = Table.Group(#"Expanded Vulnerability_Solution_Crosswalk", {"day", "vulnerability_id"}, {{"Count", each Table.RowCount(_), type number}, {"CVSS 3.0 Score", each List.Average([Vulnerability.cvss_v3_score]), type number}, {"Total Instances", each Table.RowCount(_), type number}, {"Total Exploits", each List.Sum([Vulnerability.exploit]), type number}, {"Malware Kits", each List.Sum([Vulnerability.malware_kit]), type number}}),
Line16:    // Joins with 'Vulnerability Dimensions' to enrich record(s) context.
Line17:    #"Merged Queries1" = Table.NestedJoin(#"Grouped Rows", {"vulnerability_id"}, dim_vulnerability, {"vulnerability_id"}, "dim_vulnerability", JoinKind.LeftOuter),
Line18:    #"Expanded dim_vulnerability" = Table.ExpandTableColumn(#"Merged Queries1", "dim_vulnerability", {"title", "description", "severity", "critical", "severe", "moderate","CVSS_3_Score_Category","Exploitable"}, {"Title", "Vulnerability Description", "Severity", "Critical", "Severe", "Moderate","CVSS_3_Score_Category","Exploitable"}),
Line19:    // Get row/record count. (6000 Rows)
Line20:    #"Intermediate Row Count3" = Table.RowCount(#"Expanded dim_vulnerability"),
Line21:    // Continue ETL from previous relevant step (before row count)
Line22:    // Creates Unique Index for Later Join
Line23:    #"Duplicated Column" = Table.DuplicateColumn(#"Expanded dim_vulnerability", "day", "day - Copy"),
Line24:    #"Duplicated Column1" = Table.DuplicateColumn(#"Duplicated Column", "vulnerability_id", "vulnerability_id - Copy"),
Line25:    #"Changed Type" = Table.TransformColumnTypes(#"Duplicated Column1",{{"day - Copy", type text}, {"vulnerability_id - Copy", type text}}),
Line26:    #"Added Custom" = Table.AddColumn(#"Changed Type", "VulnDateIndex2", each [#"vulnerability_id - Copy"]&"--"&[#"day - Copy"]),
Line27:    #"Replaced Value" = Table.ReplaceValue(#"Added Custom",null,0,Replacer.ReplaceValue,{"Count", "CVSS 3.0 Score", "Total Instances", "Total Exploits","Malware Kits"}),
Line28:    #"Removed Other Columns" = Table.SelectColumns(#"Replaced Value",{"day",  "VulnDateIndex2", "vulnerability_id", "Title", "Vulnerability Description", "Count", "CVSS 3.0 Score","CVSS_3_Score_Category", "Total Instances",  "Exploitable", "Total Exploits", "Malware Kits",  "Severity"}),
Line29:    // Get row/record count.(6000 rows)
Line30:    #"Intermediate Row Count4" = Table.RowCount(#"Removed Other Columns"),
Line31:    // Continue ETL from previous relevant step (before row count)
Line32:    #"Sorted Rows" = Table.Sort(#"Removed Other Columns",{{"vulnerability_id", Order.Ascending}})
Line33:  in
Line34:    #"Sorted Rows"
See photo (if it posted correctly 8-| 😞
As you can see on the right side, in blue, are the record counts at that ETL step.
At 1, you'll see the #"Intermediate Row Count" = Table.RowCount(PreviousStep)
At 2, you'll see that I continue my ETL process by referencing the step prior to the 'Table.RowCount()' function.
As you can see, I can see the ROW COUNTS as the ETL steps progress.
This solution is not ideal, but seems to work (for me anyway).
Good luck!
-Marc
- Mark as New
- Bookmark
- Subscribe
- Mute
- Subscribe to RSS Feed
- Permalink
- Report Inappropriate Content
An aternative workaround would be to create your query and next, in the Advanced Editor, add some row count steps after steps you want to verify.
My guess is that there would be a limited number of steps that could possibly influence the number of rows in your table, so you don't need to do it after each query step.
You can (de)comment the row count steps as required.
C0010 = Table.RowCount(PreviousStep),
You may also want to check again when you refresh your data: maybe rows won't be added with the current snapshot, but they might be with future data.
- Mark as New
- Bookmark
- Subscribe
- Mute
- Subscribe to RSS Feed
- Permalink
- Report Inappropriate Content


