FabCon is coming to Atlanta
Join us at FabCon Atlanta from March 16 - 20, 2026, for the ultimate Fabric, Power BI, AI and SQL community-led event. Save $200 with code FABCOMM.
Register now!- Power BI forums
- Get Help with Power BI
- Desktop
- Service
- Report Server
- Power Query
- Mobile Apps
- Developer
- DAX Commands and Tips
- Custom Visuals Development Discussion
- Health and Life Sciences
- Power BI Spanish forums
- Translated Spanish Desktop
- Training and Consulting
- Instructor Led Training
- Dashboard in a Day for Women, by Women
- Galleries
- Data Stories Gallery
- Themes Gallery
- Contests Gallery
- QuickViz Gallery
- Quick Measures Gallery
- Visual Calculations Gallery
- Notebook Gallery
- Translytical Task Flow Gallery
- TMDL Gallery
- R Script Showcase
- Webinars and Video Gallery
- Ideas
- Custom Visuals Ideas (read-only)
- Issues
- Issues
- Events
- Upcoming Events
View all the Fabric Data Days sessions on demand. View schedule
- Power BI forums
- Forums
- Get Help with Power BI
- Desktop
- Re: Rolling calculation
- Subscribe to RSS Feed
- Mark Topic as New
- Mark Topic as Read
- Float this Topic for Current User
- Bookmark
- Subscribe
- Printer Friendly Page
- Mark as New
- Bookmark
- Subscribe
- Mute
- Subscribe to RSS Feed
- Permalink
- Report Inappropriate Content
Rolling calculation
Hey, I´m trying to port reports from Crystal Reports and can´t get one visual created. I´m pretty sure its not that complicated but no way so far.
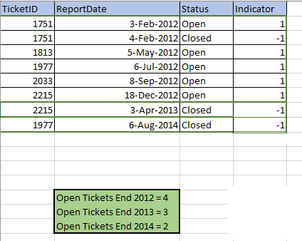
Its about reporting for a ticketing system, we want to show how many tickets were actually open at a specific point in time.
(Some tickets get closed the same day, others are closed month or even years later, so its a moving target.)
The tabel has the "ReportDate". Its the "Ticket opened Date" when the status is "Open" and ReportDate is the "ticket closed date" when the status is "Closed". "Indicator" is "+1" for open and "-1" for closed. So it should be just the SUM of the "Indicator" over "ReportDate".
But what I get is the total per year. Its 3169 for Y2012 and -171 for Y2013 rather than 2998 for Y2013.
When we drill down into the years and months, we´d like to see how many tickets were open on i.e. 03/07/2016.
Any help would be highly appreciated!
Solved! Go to Solution.
- Mark as New
- Bookmark
- Subscribe
- Mute
- Subscribe to RSS Feed
- Permalink
- Report Inappropriate Content
- Mark as New
- Bookmark
- Subscribe
- Mute
- Subscribe to RSS Feed
- Permalink
- Report Inappropriate Content
Hi @rttplm,
You need to filter the values by date use something like this:
Measure_ =
VAR date_selector =
    MAX ( Tickets[Report Date] )
RETURN
    CALCULATE ( SUM ( Tickets[Indicator] ), Tickets[Report Date] <= date_selector )
Regards,
MFelix
Regards
Miguel Félix
Did I answer your question? Mark my post as a solution!
Proud to be a Super User!
Check out my blog: Power BI em Português- Mark as New
- Bookmark
- Subscribe
- Mute
- Subscribe to RSS Feed
- Permalink
- Report Inappropriate Content
Hi, many thanks, I tried it.
The Measure over ReportDate gives me still the same number, i.e. -171 for Y2013.
It should not reset the calcuation at year end, or drilled down into the month at the end of the month.
Not sure how to achive this.
Many thanks!
- Mark as New
- Bookmark
- Subscribe
- Mute
- Subscribe to RSS Feed
- Permalink
- Report Inappropriate Content
Makes this change to.your.measure
Measure_ =
VAR date_selector =
MAX ( Tickets[Report Date] )
RETURN
CALCULATE ( SUM ( Tickets[Indicator] ),ALL(Tickets),Tickets[Report Date] <= date_selector )
However depending on the size of.your table you may get some performance issues, please check if its works fine if not please tell me si i can change it. Not in the computer righth now to test another formula.
Regards,
MFelix
Regards
Miguel Félix
Did I answer your question? Mark my post as a solution!
Proud to be a Super User!
Check out my blog: Power BI em Português- Mark as New
- Bookmark
- Subscribe
- Mute
- Subscribe to RSS Feed
- Permalink
- Report Inappropriate Content
- Mark as New
- Bookmark
- Subscribe
- Mute
- Subscribe to RSS Feed
- Permalink
- Report Inappropriate Content
Hi @rttplm,
Good to know it works, but please check if you don't get any performance issues, it's not a good practice to make a ALL filter to a table we should do it to specific fields,
If needed I can check to improve that formula if your table is not very big you can leave as is.
Regards,
Mfelix
Regards
Miguel Félix
Did I answer your question? Mark my post as a solution!
Proud to be a Super User!
Check out my blog: Power BI em PortuguêsHelpful resources

Power BI Monthly Update - November 2025
Check out the November 2025 Power BI update to learn about new features.

Fabric Data Days
Advance your Data & AI career with 50 days of live learning, contests, hands-on challenges, study groups & certifications and more!


