- Power BI forums
- Updates
- News & Announcements
- Get Help with Power BI
- Desktop
- Service
- Report Server
- Power Query
- Mobile Apps
- Developer
- DAX Commands and Tips
- Custom Visuals Development Discussion
- Health and Life Sciences
- Power BI Spanish forums
- Translated Spanish Desktop
- Power Platform Integration - Better Together!
- Power Platform Integrations (Read-only)
- Power Platform and Dynamics 365 Integrations (Read-only)
- Training and Consulting
- Instructor Led Training
- Dashboard in a Day for Women, by Women
- Galleries
- Community Connections & How-To Videos
- COVID-19 Data Stories Gallery
- Themes Gallery
- Data Stories Gallery
- R Script Showcase
- Webinars and Video Gallery
- Quick Measures Gallery
- 2021 MSBizAppsSummit Gallery
- 2020 MSBizAppsSummit Gallery
- 2019 MSBizAppsSummit Gallery
- Events
- Ideas
- Custom Visuals Ideas
- Issues
- Issues
- Events
- Upcoming Events
- Community Blog
- Power BI Community Blog
- Custom Visuals Community Blog
- Community Support
- Community Accounts & Registration
- Using the Community
- Community Feedback
Register now to learn Fabric in free live sessions led by the best Microsoft experts. From Apr 16 to May 9, in English and Spanish.
- Power BI forums
- Forums
- Get Help with Power BI
- Desktop
- Re: Rolling Sum of a Cumulative Total
- Subscribe to RSS Feed
- Mark Topic as New
- Mark Topic as Read
- Float this Topic for Current User
- Bookmark
- Subscribe
- Printer Friendly Page
- Mark as New
- Bookmark
- Subscribe
- Mute
- Subscribe to RSS Feed
- Permalink
- Report Inappropriate Content
Rolling Sum of a Cumulative Total
Hello again.
Still cannot figure out the DAX to solve my issue:
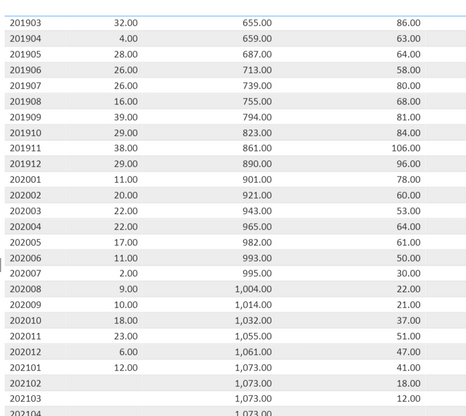
First column is yearmonth
Second column is monthly sales
Third column is cumulative sales since the launch of the product (e.g., 659 = 655+4), calculated via the following Measure:
Fourth column is rolling 3 month sum of Second column (e.g. 64 = 28+4+32), calculated via the following Measure
Could anyone please help ?
Thank you in advance.
Solved! Go to Solution.
- Mark as New
- Bookmark
- Subscribe
- Mute
- Subscribe to RSS Feed
- Permalink
- Report Inappropriate Content
Sorry, I'm not sure what you mean. I believe the measure creates a cumulative sum of your rolling 3 month sales.
"Fifth column ... WHAT IS THE MEASURE'S EXPRESSION for the 3M_Rolling_CUMULATIVE_Sales?"
Isn't that what you need?
Did I answer your question? Mark my post as a solution!
In doing so, you are also helping me. Thank you!
Proud to be a Super User!
Paul on Linkedin.
- Mark as New
- Bookmark
- Subscribe
- Mute
- Subscribe to RSS Feed
- Permalink
- Report Inappropriate Content
Try:
3 Month Cumulative =
SUMX (
    SUMMARIZE (
        FILTER (
            ALL ( 'Calendar' ),
            'Calendar'[Date] <= MAX ( 'Calendar'[Date] )
        ),
        'Calendar'[YearMonth],
        "3MonthRSales", [3M_Rolling_Sales]
    ),
    [3MonthRSales]
)
Did I answer your question? Mark my post as a solution!
In doing so, you are also helping me. Thank you!
Proud to be a Super User!
Paul on Linkedin.
- Mark as New
- Bookmark
- Subscribe
- Mute
- Subscribe to RSS Feed
- Permalink
- Report Inappropriate Content
Getting close: This created the cumulative sum of the total column since product launch. How limit that to a 3 month rolling sum ?
- Mark as New
- Bookmark
- Subscribe
- Mute
- Subscribe to RSS Feed
- Permalink
- Report Inappropriate Content
Sorry, I'm not sure what you mean. I believe the measure creates a cumulative sum of your rolling 3 month sales.
"Fifth column ... WHAT IS THE MEASURE'S EXPRESSION for the 3M_Rolling_CUMULATIVE_Sales?"
Isn't that what you need?
Did I answer your question? Mark my post as a solution!
In doing so, you are also helping me. Thank you!
Proud to be a Super User!
Paul on Linkedin.
- Mark as New
- Bookmark
- Subscribe
- Mute
- Subscribe to RSS Feed
- Permalink
- Report Inappropriate Content
Awesome ! Actually it worked great. Previous issue was myy mistake. Was taking the wrong variable !!
- Mark as New
- Bookmark
- Subscribe
- Mute
- Subscribe to RSS Feed
- Permalink
- Report Inappropriate Content
@JMSNYC , Create a measure like this with date table and try
Rolling 3 = CALCULATE(sum(Sales[Sales Amount]),DATESINPERIOD('Date'[Date ],MAX('Date'[Date ]),-3,MONTH))
Microsoft Power BI Learning Resources, 2023 !!
Learn Power BI - Full Course with Dec-2022, with Window, Index, Offset, 100+ Topics !!
Did I answer your question? Mark my post as a solution! Appreciate your Kudos !! Proud to be a Super User! !!
- Mark as New
- Bookmark
- Subscribe
- Mute
- Subscribe to RSS Feed
- Permalink
- Report Inappropriate Content
Unfortunately, it does not work. This is the formula I used in Column 4 (with LASTDATE vs. MAX), but still gives me same output 😞
Helpful resources

Microsoft Fabric Learn Together
Covering the world! 9:00-10:30 AM Sydney, 4:00-5:30 PM CET (Paris/Berlin), 7:00-8:30 PM Mexico City

Power BI Monthly Update - April 2024
Check out the April 2024 Power BI update to learn about new features.

| User | Count |
|---|---|
| 105 | |
| 96 | |
| 79 | |
| 66 | |
| 62 |
| User | Count |
|---|---|
| 145 | |
| 113 | |
| 105 | |
| 85 | |
| 65 |


