FabCon is coming to Atlanta
Join us at FabCon Atlanta from March 16 - 20, 2026, for the ultimate Fabric, Power BI, AI and SQL community-led event. Save $200 with code FABCOMM.
Register now!- Power BI forums
- Get Help with Power BI
- Desktop
- Service
- Report Server
- Power Query
- Mobile Apps
- Developer
- DAX Commands and Tips
- Custom Visuals Development Discussion
- Health and Life Sciences
- Power BI Spanish forums
- Translated Spanish Desktop
- Training and Consulting
- Instructor Led Training
- Dashboard in a Day for Women, by Women
- Galleries
- Data Stories Gallery
- Themes Gallery
- Contests Gallery
- QuickViz Gallery
- Quick Measures Gallery
- Visual Calculations Gallery
- Notebook Gallery
- Translytical Task Flow Gallery
- TMDL Gallery
- R Script Showcase
- Webinars and Video Gallery
- Ideas
- Custom Visuals Ideas (read-only)
- Issues
- Issues
- Events
- Upcoming Events
The Power BI Data Visualization World Championships is back! Get ahead of the game and start preparing now! Learn more
- Power BI forums
- Forums
- Get Help with Power BI
- Desktop
- Re: Report Help -
- Subscribe to RSS Feed
- Mark Topic as New
- Mark Topic as Read
- Float this Topic for Current User
- Bookmark
- Subscribe
- Printer Friendly Page
- Mark as New
- Bookmark
- Subscribe
- Mute
- Subscribe to RSS Feed
- Permalink
- Report Inappropriate Content
Report Help -
Hi
Im trying to Create a report that lists by month, top 10 categories month by month, some will change each months so in need to reflect this , is this possible?
Solved! Go to Solution.
- Mark as New
- Bookmark
- Subscribe
- Mute
- Subscribe to RSS Feed
- Permalink
- Report Inappropriate Content
Hi @dommyw277 ,
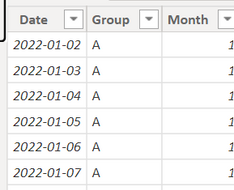
I created some data:
Here are the steps you can follow:
1. Create measure.
Count =
var _select=SELECTEDVALUE('Table'[Month])
return
COUNTX(FILTER(ALL('Table'),'Table'[Month]=_select&&'Table'[Group]=MAX('Table'[Group])),[Group])
rank =
RANKX(ALL('Table'),[Count],,DESC,Dense)Flag =
IF(
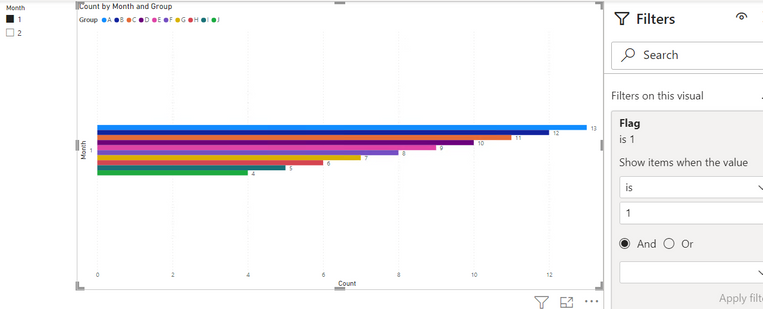
[rank]<=10,1,0)2. Place [Flag]in Filters, set is=1, apply filter.
3. Result:
For errors, you can refer to:
If I have misunderstood your meaning, please provide your desired output and your pbix without privacy information.
If you need pbix, please click here.
Best Regards,
Liu Yang
If this post helps, then please consider Accept it as the solution to help the other members find it more quickly
- Mark as New
- Bookmark
- Subscribe
- Mute
- Subscribe to RSS Feed
- Permalink
- Report Inappropriate Content
Thank you so much! Works a treat
- Mark as New
- Bookmark
- Subscribe
- Mute
- Subscribe to RSS Feed
- Permalink
- Report Inappropriate Content
So using the table I have called ReportData , the fields are Category and Month , I have this - can anyone help where im going wrong please?
calculate(Sum(ReportData[Category]) ,TOPN(10,all(ReportData[Category]),calculate(Sum(ReportData[Month]) )), values(ReportData[Category]))
- Mark as New
- Bookmark
- Subscribe
- Mute
- Subscribe to RSS Feed
- Permalink
- Report Inappropriate Content
Hi,
This measure is correct. What problem are you facing?
Regards,
Ashish Mathur
http://www.ashishmathur.com
https://www.linkedin.com/in/excelenthusiasts/
- Mark as New
- Bookmark
- Subscribe
- Mute
- Subscribe to RSS Feed
- Permalink
- Report Inappropriate Content
The issue appears to be that im trying to SUM Text fields so maybe thats why the TOP n argument isnt working?
calculate(Sum(ReportData[Category]) ,TOPN(10,all(ReportData[Category]),calculate(Sum(ReportData[Month]) )), values(ReportData[Category]))
- Mark as New
- Bookmark
- Subscribe
- Mute
- Subscribe to RSS Feed
- Permalink
- Report Inappropriate Content
Hi,
Does this work?
=calculate(countrows(ReportData) ,TOPN(10,all(ReportData[Category]),calculate(Sum(ReportData[Month]) )), values(ReportData[Category]))
Regards,
Ashish Mathur
http://www.ashishmathur.com
https://www.linkedin.com/in/excelenthusiasts/
- Mark as New
- Bookmark
- Subscribe
- Mute
- Subscribe to RSS Feed
- Permalink
- Report Inappropriate Content
Hi, so ReportData is replaced by NewCherwell however i get these messages. Maybe because Month is a part of created date time?
- Mark as New
- Bookmark
- Subscribe
- Mute
- Subscribe to RSS Feed
- Permalink
- Report Inappropriate Content
Hi,
I cannot help without having access to your file.
Regards,
Ashish Mathur
http://www.ashishmathur.com
https://www.linkedin.com/in/excelenthusiasts/
- Mark as New
- Bookmark
- Subscribe
- Mute
- Subscribe to RSS Feed
- Permalink
- Report Inappropriate Content
Hi im getting this message:
ReportData is replaced by CherwellNEW for info
- Mark as New
- Bookmark
- Subscribe
- Mute
- Subscribe to RSS Feed
- Permalink
- Report Inappropriate Content

- Mark as New
- Bookmark
- Subscribe
- Mute
- Subscribe to RSS Feed
- Permalink
- Report Inappropriate Content
@dommyw277 , Create a TOPN measure and display is with month and category
calculate(Sum(Table[Value]) ,TOPN(1,all(Table[category]),calculate(Sum(Table[Value]) )), values(Table[category]))
or refer this
https://www.sqlbi.com/articles/filtering-the-top-3-products-for-each-category-in-power-bi/
Helpful resources

Power BI Dataviz World Championships
The Power BI Data Visualization World Championships is back! Get ahead of the game and start preparing now!

| User | Count |
|---|---|
| 39 | |
| 35 | |
| 34 | |
| 32 | |
| 27 |
| User | Count |
|---|---|
| 136 | |
| 96 | |
| 77 | |
| 67 | |
| 65 |


